|
Financial Professionals Fall 2025
This is my quarterly agglomeration, intended primarily for my fellow financial professionals. It’s simply a way to share things of possible interest that I have read or thought about this quarter. Enjoy!
I think this is the longest one ever. Sorry about that, but I hope you get something out of it!
First, perhaps unsurprisingly, intelligent people are better at forecasting. (PDF)
Second, a nice chart to see how you stack up:
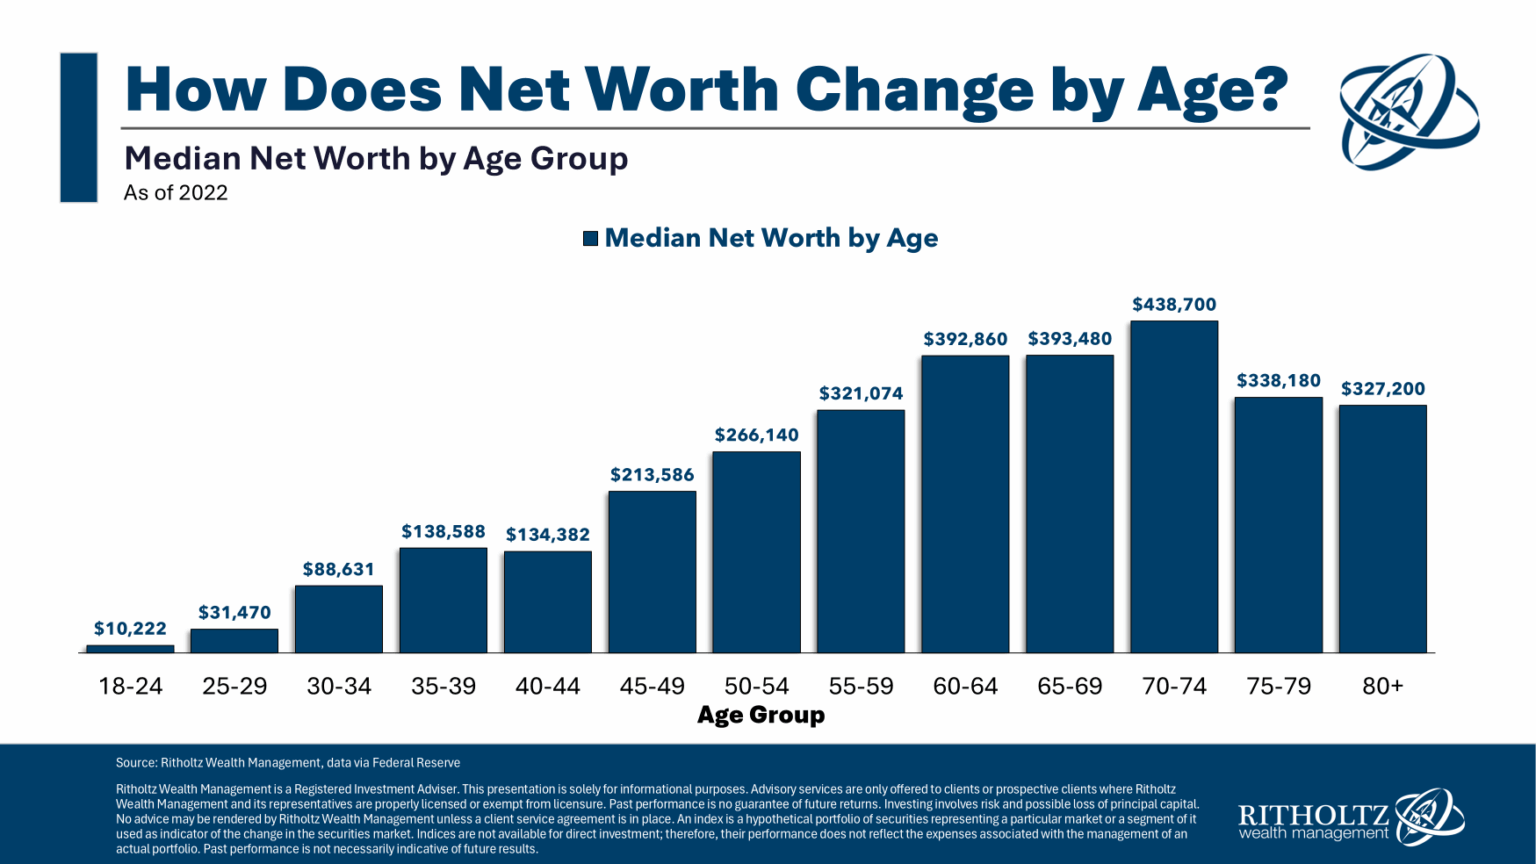
I like that it is median and not average. That’s a much better benchmark due to significant positive skewness in the distribution.
But, even if you are doing better than those numbers you still may not feel rich, because as Nick Maggiulli points out, the upper middle class isn’t special anymore.
Also see this article.
You can also see how much people make here.
Third, I’ve talked about this many times, for example, in 2018:
I read this article on business management (or, more precisely, how not to be confused about what constitutes good management), and I’m including it here because the three points at the end apply perfectly to investment management as well:
- Recognize the role of uncertainty.
- See the world through probabilities.
- Separate inputs from outcomes
Those three points are interrelated. I would put it this way: Because everything in the world is more or less uncertain, one should think in terms of probabilities and realize that good decisions sometimes lead to poor outcomes (and vice versa). As I wrote a long time ago (and reposted a year ago here):
[A] good decision is not the same thing as a good outcome, though they should be correlated. For example, investing all of your retirement funds in lottery tickets or one single stock is a bad decision even if you happen to win the lottery or the stock skyrockets. Conversely, investing in the market (prudently, with an appropriate asset allocation, etc.) is a good decision, even if the market subsequently crashes.
I wrote about it again in 2019: “Good decisions/actions are correlated with good outcomes, but the correlation is less than one. “Investing” your life savings in lottery tickets is a bad decision even if you happen to win. Carrying P&C insurance on your house is a good decision even if it never burns down.”
But it’s always good to be reminded.
Fourth, an interesting observation: An investor who beat the market (S&P 500) by 5% a year from 1960-1979 or 2000-2019 had less money at the end than an investor who underperformed the market by 5% a year from 1980-1999.
In addition, per The Economist: “Of all the progress of the past 10,000 years in raising human living standards, half has occurred since 1990.”
When you happen to be alive and investing matters a lot!
Fifth, the newsletter that went out last quarter had numerous links to PE stuff (here), but they keep coming. Here is an interesting analysis.
My (undoubtedly oversimplified) synopsis is that PE is worth about 70% of what the funds are listed for (“Today, these listed PE funds trade at 70 cents on the dollar!”) and have true volatilities of about 1.7x (24/14) what they claim. (“Traditional reporting by these PE funds has their NAV average at 14% volatility, about 0.9 times the market average of 16%. By annualizing the volatility of the stock trading price, one can see in the figure below that the market volatility is closer to 24%, or 1.5 times the market average.”)
(Academic paper here. There is a rebuttal however.)
Also, note this WSJ headline: “Jamie Dimon Says Private Credit Is Dangerous—and He Wants JPMorgan to Get In on It”
I couldn’t help but be reminded of Chuck Prince back in 2007 (here or here):
The Citigroup chief executive told the Financial Times that the party would end at some point but there was so much liquidity it would not be disrupted by the turmoil in the US subprime mortgage market.
He denied that Citigroup, one of the biggest providers of finance to private equity deals, was pulling back.
“When the music stops, in terms of liquidity, things will be complicated. But as long as the music is playing, you’ve got to get up and dance. We’re still dancing,” he said in an interview with the FT in Japan.
That did not end well, as noted in a HBS case study (here):
By year-end 2006 the firm had a market capitalization of $274 billion, with $1.9 trillion in assets and $24.6 billion in earnings. But ten years after the merger it ended in tears. In July of 2009, the firm was effectively nationalized, with billions of dollars in bailout money converted into a 34% ownership stake for the U.S. government. Citigroup was worth less than $16 billion, having lost more than $250 billion in value from its peak.
(The soundtrack for that.)
Also see also this article on whether you need PE. It has the apt Swensen quotes:
- “Non-core asset classes provide investors with a broad range of superficially appealing but ultimately performance-damaging investment alternatives.”
- “Even if a [private-equity] index existed, based on past performance, index-like returns would fail to satisfy investor desires for superior risk-adjusted returns. In fact, only top-quartile or top-decile funds produce returns sufficient to compensate for private equity’s greater illiquidity and higher risk.”
- “In the absence of truly superior fund selection skills (or extraordinary luck), investors should stay far, far away from private equity investments.”
Hedge funds are no better: “University of California divests from hedge funds with scathing criticism” (here or here)
I expect a similar article about other types of alts a decade or two from now…
Here are some additional PE articles: 1, 2, 3.
Sixth, good details on global aging and some of the implications here. TL;DR: it’s less dire than you probably thought.
Seventh, stocks for the long run? Excellent discussion here with the heavyweights: McQuarrie, Dimson, Siegel, Ibbotson, Arnott, and Bessembinder.
(See also my previous posts on this topic: 1, 2, 3, 4, 5.)
Eighth, more on 351s here (or here).
Ninth, “There are two types of wealthy people: those who desperately want you to know they are wealthy and those who desperately don’t.” – Mark Brooks
Tenth, when it comes to structured products, as Larry Swedroe points out here and here, just allocate to bonds! I also love his calling these “Boomer Candy.”
I agree with Larry’s points, but he left out that you don’t get the dividends either.
This isn’t new; I learned about this strategy (albeit not in a nice wrapper) in 1989. You could “guarantee” the client they wouldn’t lose money over a time horizon of X, simply by:
- Investing in a zero-coupon bond that matured at 100% of their original investment at the time horizon.
- Invest the “left over” (the discount to par of the bond) in call options (after fees, of course).
Of course, that strategy, as with these new products, completely ignores the risk-free rate (i.e., opportunity cost). You aren’t “even” if you simply get your money back, you are behind by the amount that you could have earned risk-free. These products are coming back now because interest rates are higher. In a zero-rate environment, you can’t make this work since you need roughly 100% of investment in the Treasurys so there’s nothing left to buy any calls (especially after any fees).
Related, this paper is about ETFs, but registered/fixed-indexed/index-linked annuities have similar structures.
Always remember, TANSTAAFL.
Eleventh, in research that should surprise no one, “people often seek advice to validate their preferred choice rather than improve the quality of their decisions. Instead of seeking objective, unbiased advice, advice seekers engage in behaviors to obtain preference-congruent advice. They choose advisors who they think are more likely to recommend their preferred option, and they frame their advice requests in ways that favor their preferred choice.”
Twelfth, I was explaining to someone recently about duration calculations; the CFP exam (I think) elides the distinction between Macaulay Duration and Modified Duration so I thought I’d explain it here and give some data also. Even if you aren’t interested in the duration portion, the mortgage math at the end may be useful to you so I recommend at least skipping down to that portion and reading it. (Numbers are from August 2nd when I did this originally.)
Macauley Duration
This is used to immunize a portfolio, for example defeasing the interest-rate risk in a pension plan. The formula, in English, is simply the present value of all the cash flows multiplied by when they happen divided by the current price.
(If you want to see the actual formulas, see here.)
So (using this data), a 30-year Treasury bond has a 4.75% coupon and a $98.86 price for a YTM of 4.82%. (In Excel, keeping in mind bonds pay interest semi-annually: =RATE(30*2,47.5/2,-988.6,1000)*2)
The Macauley Duration of that bond is 16.20 years. The difference between duration and maturity I think surprises people. This is why it is hard (or impossible) to get long enough durations in a pension plan to fully immunize it without shorting some shorter-term bonds. Remember, the duration of a portfolio is simply the weighted average duration of bonds held in that portfolio. Let me do one more bond calculation and then I can explain that better with an example.
Just like I did two paragraphs back, let’s calculate the duration of a 10-year Treasury bond. It has a 4.25% coupon and a $100.27 price for a YTM of 4.22%. (In Excel: =RATE(10*2,42.5/2,-1002.7,1000)*2) The Macauley Duration of that bond is 8.25 years.
Going back to how to lengthen durations. If you shorted the 10-year and bought equivalent amounts of the 30-year you can get longer durations. Suppose you went long 150% the 30-year and short 50% the 10-year. 16.2*1.5 + 8.25*-0.5 = 20.175, which you can see is longer than just having 100% in 30-year Treasurys. You can lever up Treasurys a lot so perhaps you could run a 190%/-90% portfolio. That would give you a duration of 23.36.
We can do better if we use a shorter-term bond as the short leg of this trade. A 12-month Treasury has no coupon (they are bought at discounts), and the price is quoted as the amount below par that you buy it for. So, right now it shows a price of 3.69, which means you pay $96.31 to get $100 in a year for a YTM of 3.83%. (100/96.31-1). The Macauley Duration of that bond is one year (there are no intermediate cash flows).
If we did a portfolio of 190% the 30-year and -90% the 12-month, then our portfolio duration would be 29.88 – pretty close to what you could get from a 30-year zero-coupon bond. Of course, we could use a 30-year zero in our portfolio as well. The math here is easy. We would be long 190% with a duration of 30 and short 90% with a duration of 1. The duration of the portfolio then would be 56.1. If interest rates move the wrong way, this trade can absolutely blow you up though (see here for an example).
Modified Duration
This is used to calculate the shift in the value of a bond for a one-percent change in interest rates (with the assumption that it creates a shift in the overall yield curve, rather than changing the slope, etc.). This is simply the Macauley Duration divided by one plus half the yield (because semi-annual payments). So, for the 30-year with a 16.2 Macauley Duration, the Modified Duration would be 16.2 / (1+(0.0475/2)) = 15.83. At low interest rates, the difference in the two durations is obviously not very big.
Mortgages
You can also do a duration calculation of a mortgage. The rule of thumb is that the duration is roughly the same as a 10-year Treasury. Let’s see where it is now. Using a brand-new mortgage with a rate of 6.78% (national average here), the Macauley duration is 10.29.
I built a spreadsheet for doing this a long time ago: Duration Calculator for Stocks, Bonds, & Mortgages (I used that spreadsheet for the duration calculations above.)
You can also use the mortgage section of that so see how much “ahead” you are on your mortgage (if you have one) since rates have declined. As an example, given the low rates available a few years ago, having the largest, longest, fixed-rate mortgage possible seemed like a good bet – and it paid off. Essentially, you could be short fixed-income that was callable at par (you can refi or pay it off at any time) with a very low rate. Suppose you ended up with a 2.75% at what was then the limit before it became a jumbo. Here’s the current situation on that mortgage (based on an actual case):
Mortgage |
Term (years): |
25.5 |
Mortgage Rate: |
2.750% |
Current Rates: |
6.780% |
Balance: |
$454,964 |
Current Value: |
$301,059 |
Macaulay Duration (years): |
9.30 |
Effective Duration (years): |
9.25 |
So, if the borrower could buy back the mortgage at the market value, they could do so at $154k less than what the balance is. I wish we had a mortgage system like the Danes (details here or here).
You could also look at that this way: paying off that mortgage would be a $154k gift to the lender!
I’m not sure the “Current Rates” is exactly the right way to look at this as an investment opportunity though. Remember above we showed that a 10-year Treasury is similar in duration; the borrower could take money out of fixed-income in their portfolio and pay off the mortgage. As a reminder, the rate on the 10-year Treasury is 4.82%. These are roughly equivalent investment opportunities in the sense that they are similar durations and both risk-free to the borrower. (If they pay off the mortgage it is even more certain they won’t have to make mortgage payments than it is the government will make the interest payments on the Treasurys.)
So, using the alternative rate, it changes to:
Mortgage |
Term (years): |
25.5 |
Mortgage Rate: |
2.750% |
Current Rates: |
4.820% |
Balance: |
$454,964 |
Current Value: |
$364,245 |
Macaulay Duration (years): |
10.25 |
Effective Duration (years): |
10.21 |
They would still lose $91k to pay off the mortgage. Of course, we didn’t really need to do all that because 2.75%<4.82%.
But we haven’t adjusted for taxes. This is a little complicated because (of course) you should use proper asset location and preferentially put fixed-income (ordinary-income) investments in retirement accounts, but suppose they have Treasurys in the taxable account. Assume with the SALT limit and the low mortgage rate and balance, they are unlikely to itemize. But they would pay taxes on the Treasury interest. There are no state income taxes on Treasurys, so assume a 37% rate plus 3.8% NII tax for a total of 40.8%. The net interest earned on the Treasurys in that situation would be (1-0.408)*4.82% = 2.85%. Well now it’s pretty much a wash; just 7 bps difference. If they don’t have fixed income in their taxable account, or simply desire liquidity, I think it’s still compelling to keep the mortgage, but it’s a much closer call than you would probably think without doing the math.
Thirteenth, while not about investing at all, this article points out that you should check your progress (or portfolio) less frequently.
Fourteenth, your memory is a problem. This is why I highly recommend reading a lot of market history. A great place to start is the Wiley Investment Classics series. I’d read them by publication date; they did the better ones first. Here is a list sorted that way.
Fifteenth, two years ago (here) I passed along this suggestion: “When explaining MCS results to clients, don’t say, ‘You have a 90% probability of success.’ Rather say, ‘You have a 10% chance of having to adjust your portfolio distributions downward.’”
Anyway, I was just doing some “refresher readings” from the CFA Institute on the topic of wealth management, and they would call that situation a “10% probability of ruin.”
(Granted they are writing for the professional, and not to the client, but still! Ruin? Seriously?)
In those readings, I learned something. I wrote about umbrella coverage a long time ago (here) and, as you know, $1,000,000 is a common coverage level for middle-class families, but according to the reading, there is apparently a “standard” amount for HNW/UHNW folks too:
In the United States, a standard recommendation is a personal umbrella insurance coverage of around USD20 million to shield against frivolous and serious legal claims. This amount generally surpasses most court judgments, providing robust asset protection and minimizing the need for out-of-pocket expenses. This level of coverage is more than sufficient for most legal challenges.
I did not know that.
Sixteenth, the Section 121 exclusion (sale of a personal residence) was set at $500k for MFJ (half that for single) back in 1997. The limit is not adjusted for inflation; if it were, it would currently be roughly double those figures. There is a little movement in Congress to exclude all gains from tax, but it’s very early days. (I would prefer they didn’t have any exclusion at all, but rather index the basis for inflation – so you only pay on real gains. For stocks, etc. too.)
Seventeenth, nobody paid 90% income tax rates in the 1950s. I’ve been debunking this for decades when it comes up, and here is a very good (and short) video explanation.
My point was usually in the context of Roth conversions where people assume that rates are going to skyrocket in the future. I stressed that we have tended, since the 1950s, to have lower marginal rates on a broader base, and that could very well persist (and I could be wrong, of course). That broader base could also include a VAT at some point. (I’m not advocating that, just pointing it out. Also, tariffs are generally regressive, and that’s the current trend!)
Further, the recommendation by the bipartisan Simpson–Bowles commission in 2010 was for: “Three brackets: 12%|22%|28%” (PDF)
I would not be shocked at a 28% top rate at some point (that’s what it was from 1988-1991 before H.W.’s breaking of his memorable pledge – which probably cost him the 1992 election.) OTOH, I would not be shocked to see much higher marginal rates either! My quibble is with people who think they know what will happen. Wealth management is applied epistemology – the most important data (future tax rates, market returns, etc.) is contingent and uncertain. Low-quality advisors pretend (or don’t know!) that it isn’t.
The better metric to watch, in my opinion, is the ratio of taxes to GDP over time. That’s how onerous taxes are, and it’s been remarkably stable since the end of WWII:

(I blame the increase after WWII on the invention of withholding. Milton Friedman came up with it and later regretted it.)
The above is the ratio of taxes to GDP. Those are stable (as I pointed out), the problem is on the spending side (and the cause is bipartisan):

The trend was down in the Clinton administration, but has been up since then. The recent spike is COVID spending (obviously) but we haven’t gone back to the previous level since then. The 2024 number (last data-point) on that chart is 23.13%, while the equivalent point on the previous chart is 16.85%. The difference of 6.28% is deficit spending – i.e., borrowing to spend.
There’s a graph for that too, of course:

It’s by no means a straight line, but the trend since 2000 has not been good (to put it mildly).
Eighteenth, I recently read this (talking about the market caps of Nvidia and Microsoft crossing $4 trillion):
Anticipating that both companies would reach $4 trillion, Wedbush analysts wrote in June that they could reach the $5 trillion landmark in the next 18 months, noting the “tech bull market is still early, being led by the AI Revolution.”
Now, I realize they said “could,” but from $4 to $5 is obviously a 25% rate of return. On companies that are already the largest ones that exist, that already have PE ratios of 58.5 and 38.3, respectively, that the market somehow hasn’t already priced. (If everyone thinks they “will” be worth $5 trillion in 18 months, then they will be worth almost that now – “almost” because you would discount for 18 months at the risk-free rate and for the chance that they won’t be that.)
This is starting to feel very late-1990s. (As does this, but there are arguments to the contrary.)
Nineteenth, very good elementary explanation of how stocks work. Also, David Booth recently shared some very basic information on investment philosophy that may be helpful for a neophyte here.
Twentieth, is the first $10,000 the most important (source)? This is something that we tend not to think about because we aren’t there, but I think it’s true.
OTOH, (and maybe attribute this to my cynicism) I am pretty skeptical that people who don’t have that first $10,000 would maintain that level if they didn’t accomplish it themselves. In other words, I think the people who became much better off from the COVID checks have at this point frittered it away and are right back where they started. Someone working and saving to get there is great, and they will likely move on to ever-higher levels. But if we somehow just gave everyone $10,000, it would only help in the shortest of terms.
Anyway, an excerpt from The Wealth Ladder: Proven Strategies for Every Step of Your Financial Life is here. Good concept:
This categorisation of wealth into levels also explains why different financial experts give seemingly contradictory advice.
One may argue that budgeting is the key to financial success, while another claims that starting a business is more important. Who is right?
The Wealth Ladder teaches us that both of them are, they are just talking to people at different levels on the Wealth Ladder.
Also, here, the list of “Four High Income Paths to Consider” is excellent (though it’s missing a hyphen, it should be “High-Income Paths”).
I always thought of the path to higher income as mostly being a function of leverage. If you are essentially getting paid by the hour it’s hard to make very much unless you can significantly increase your productivity (do 10x or 100x more per hour than other people can), and in most professions that’s difficult or impossible. The other way to have leverage is to manage a lot of people so you are getting paid on their work.
Interestingly, being a high-quality wealth manager (which I would posit includes having credentials and technical expertise) with your own firm, or at least equity, arguably hits all four items!
Twenty-First, I thought you might find my final response to a wholesaler in an e-mail exchange interesting (he was pitching an opportunity zone investment):
The main (though not only) issue for me would be the enormous overweight in a portfolio. The market cap appears to be $2.673 million. Since the U.S. public markets are $60 trillion or so, for every million dollars in listed domestic equities, investors should have four cents in your fund. Tax-advantages, confidence in your product, etc. may indicate an overweight, but even a 10x overweight (which would be huge) is forty cents.
(See also: Why We Don’t Invest in Alts.)
Twenty-Second, I was reading something that mentioned there were seven states with unlimited homestead exemptions. I was aware of FL and TX, but I didn’t know what the others were. Anyway, I found a nice table that shows the details for every state. (The other states, besides FL and TX, with unlimited amounts are AR, IA, KS, OK, SD, also DC and PR.)
Twenty-Third, I have seen lots of articles on the Social Security trust fund exhaustion, and you may be getting client questions. I thought the mechanics were obvious (to professionals, not lay people), but I’ve recently become aware (through some conversations, articles, etc.) that they may not be. For example, in this article, which someone sent me, the author seems somewhat confused. Under “common myths” she writes:
“Congress takes money from the Social Security trust fund.” Not true: At no time has Congress ever “robbed” the trust fund. In fact, the fund is invested in special-issue government bonds that cannot be used for any other purpose.
The latter portion of that literally means the government has taken the money from the trust fund (that’s what bonds are – documentation of borrowing) and spent them elsewhere. “Robbed” has a negative connotation and is not perfectly accurate (robbers generally don’t leave IOUs), but they (Congress) absolutely did take the money and spend it already; but they pinky-promise (the Treasurys) to give it back when needed.
The analogy I have sometimes used (which may, or may not, help – YMMV) to explain the “trust fund” is that it’s like a household (with no investment portfolio, just to make it simple and clear) taking the money out of the kids’ college fund to pay down the mortgage and putting an IOU in the college fund so it’s still “funded.” Sort of, I guess, the IOU is an asset (though the credit quality may or may not be high depending on the household). But the implication is that at some point (when the kids go to college) the mortgage balance is going to get run back up (HELOC?) to get the funds to pay that IOU. That’s where we are with SS right now – the kids are in college, and the IOUs are being redeemed.
I’ll try to explain here why the trust fund running out of money in the early 2030’s is an accounting issue, not a cash flow issue (from the government’s perspective). The annual net taxes, borrowing, etc. do not change just because the “trust fund” hits a zero balance. From a macro perspective, the amounts and trends of the deficit, debt, taxes, spending, all continue; there are no discontinuities when the trust fund is empty.
Anyway, a few points before I get into it:
- I’m not saying that there is nothing to worry about with regard to the state of the fisc overall, I’m merely saying that the fact that a “trust fund” runs out of money really doesn’t matter (unless the politicians make it matter).
- There are two Social Security trust funds (OASI and DI), and two Medicare trust funds (HI and SMI). The DI and SMI are fully funded indefinitely, the OASI and HI are projected to run out of funds in 2034 and 2033 respectively. (And the OBBB made it worse.)
- I’m just going to do a very simplified explanation about a single fund, I’ll call it Social Security, but the logic would apply to any/all of them. It helps when we go through this to think of Social Security and the related trust fund as being a completely separate entity from the government. In other words, when I write “the government” I mean the non-Social Security (i.e., general fund) part.
Here are the moving parts to understand:
- The trust fund holds Treasurys (special Treasurys, but Treasurys nonetheless). This means the trust fund’s asset is a debt of the U.S. Government.
- The trust fund takes in money from dedicated taxes (FICA, etc.) and spends on retirees. The spending is currently higher than the income, so they (the trust fund) cash in some of the bonds to get dollars to pay the full expenses.
- The government also spends more than it takes in, and to do so borrows using Treasurys issued to the public.
- When the government needs to give the money to the trust fund (for the Treasurys they – the trust fund – are cashing in), it doesn’t have any money to do so. So, it issues more Treasurys (to the public) to get those funds.
- If you follow the cash flows, right now the government is issuing Treasurys to (i.e., borrowing from) the public to fund the Social Security shortfall, but it washes through the trust fund by the mechanism of bond redemption.
In short, there is no difference in 2030-whatever if the government just writes checks directly to Social Security (or the trust fund) to make up the shortage – they are doing that now!
Now, Congress may use the fake crisis to adjust Social Security taxes or benefits (and they almost certainly will, and should). If they don’t pass a bill then Social Security checks would be smaller because the revenue coming into Social Security isn’t enough to cover the full amount, but that would simply mean the government would be borrowing less on an ongoing basis than they were previously.
The chance that Congress will allow pensioner’s checks to be suddenly cut because a trust fund is out of money is, IMHO, roughly zero.
I hope that makes sense. My explanation still seems a little muddled, but I promise the concepts are correct even if I didn’t explain them clearly.
Twenty-Fourth, I’m slightly concerned that the recent politicization of the BLS will eventually affect not only the jobs report (the recent kerfuffle), but also CPI. Suppressing reported inflation would help the government a great deal. Not only the optics for President Trump, but also wages, etc. would increase but tax brackets (and other IRS limits) wouldn’t. Plus, Social Security payments would be lower. Perhaps most pertinent to us, TIPS would not pay as much as they should. Interestingly, and the thought will probably make your head hurt, markets should price this. In other words, the price of TIPS should decline to the point where the yield on TIPS is still the approximate real rate vs. nominal Treasurys. (You did lose money on the decline though.)
Twenty-Fifth, for a very long time I have thought that the earnings yield (E/P) should be a rough estimate of real stock returns. So, comparing that to a long-term TIPS yield would give you a rough approximation of the ERP. (And recently I saw that the folks at Elm agree.)
The current market PE is 24.79 (trailing) and 23.74 (leading). So, the earnings yield is about 4.0-4.2%. 30-year TIPS are at 2.6%. That means the ERP is just 1.4% to 1.6%. That is, to say the least, alarming.
That has me very concerned. Along the same line of thought, above I said, “This is feeling very late-1990’s....” I have been arguing with myself the other side of this: What would make that valuation justified?
- The obvious candidate is AI. The theory would be that companies can be much more efficient – primarily by reduced payroll which would lead to increased profits. There is a fallacy of composition here though. If one company got AI, it would be true (for that company). But if they all get AI then they still compete on price, and the earnings don’t change. (Though the earnings may redistribute from the maladroit to the nimble.) The surplus flows to the consumer, not the owner.
- If, as posited above, payrolls are reduced, that may well induce a slowdown in the economy and perhaps even a recession.
- In the long run it will be fine though because people will eventually do different things. Our wants are unlimited. I.e., it’s a fallacy that the total amount of work is finite, so improved productivity leads to unemployment. Perhaps in the short term, but in the long term people will do something. “In 1870, almost 50 percent of the U.S. population was employed in agriculture.” (source) Today that figure is about 2%. We don’t have half the population unemployed because there’s not enough agricultural jobs though. (That’s not to minimize the problems that individuals may have as their jobs are eliminated.)
- Here’s an excerpt from the 1934 book, The Economy of Abundance:
The technocrats promised every family on the continent of North America $20,000 a year, and a sixteen-hour work week. This is perhaps the peak of promises based on an abundance economy. Charles P. Steinmetz saw a two-hour working day on the horizon—he was the scientist who made giant power possible—but he stipulated no family budget total beyond “necessities and comforts.”
…
Fred Henderson, in his Economic Consequences of Power Production, is more specific: “Without any further increase in our knowledge of power and of technical processes, or of our available materials, we could multiply production ten times over if the needs of the world were permitted to express themselves in effective demand. … It would not be a question of an eight-hour day or a six-day week, but more probably of a six-months working year—which is already the rule for university dons.”
Buckminster Fuller is still more definite. Modern man, he calculates, is 630 times more able than was Adam. Eliminating wasteful forms of work, four million Americans laboring fifty-two seven-hour days in the year (364 working hours, an average of one per day) “could keep up with every survival need”—meaning basic necessities for the whole population.
Walter N. Polakov announces that “fifty weeks, four days, six hours is enough”—a twenty-four hour week and two weeks’ vacation…
Harold Rugg in The Great Technology estimates a possible minimum living standard between ten- and twenty-fold greater than the minimums of 1929, on a sixteen- to twenty-hour work-week. …
One can continue to cite such evidence indefinitely. Fortunately, A. M. Newman has been collecting it for years and saves us the trouble by the following summary: “Among them [such estimates] a substantial agreement is found that by better use of the mechanical facilities at our disposal we could produce many times our present supply of goods at considerably less effort.” The five-hour day tends to be the maximum estimate in Mr. Newman’s collection.
Perhaps better known is Keynes prediction in Economic Possibilities for our Grandchildren:
For many ages to come … everybody will need to do some work if he is to be contented. We shall do more things for ourselves than is usual with the rich today, only too glad to have small duties and tasks and routines. But beyond this, we shall endeavour to spread the bread thin on the butter—to make what work there is still to be done to be as widely shared as possible. Three-hour shifts or a fifteen-hour week may put off the problem for a great while.
Twenty-Sixth, financial planning in a nutshell:
“Your success depends on the risks you take. Your survival depends on the risks you avoid.” – James Clear
Twenty-Seventh, ETF tax games continue, first BOXX and XDIV, now CPAG and CPHY:
F/m Compoundr U.S. Aggregate Bond ETF (CPAG)
F/m Compoundr High Yield Bond ETF (CPHY)
Twenty-Eighth, IMHO this is not going to end well. From the FAQs:
Basic Capital offers $4 of financing for every $1 you contribute, but only on eligible assets – broad market stocks and bonds intended to be held for the long-term. The financing is also long-term, and not subject to mark-to-market liquidation.
…
Basic Capital financing is currently 6.25% and can only be secured with eligible assets, but provides substantially more investing power without the risk of marked-to-market liquidation.
NB: “broad market … bonds” which I assume would be something like the AGG which has a yield of 4.34% at 6.25% financing. That’s a pretty massive bet that interest rates will decline significantly!
Apparently, there’s nothing wrong with 401(k) plans that can’t be solved by simply adding a lot of leverage (or alts)! Coming soon (I assume), zero-day options!
Twenty-Ninth, I’ve debunked the concept of “time diversification” repeatedly (it was one of my points at a NAPFA conference recently in NYC), and it was just addressed in a new Center for Retirement Research Brief. I highly recommend reading pages 2-3 of that PDF. (The papers they reference may be found here, here and here.)
My previous writings on this (which said much the same thing) are here and here.
For an even better explanation see this (if you have access), or, optimally, get, and read, Kritzman’s book.
Thirtieth, “Here’s what I’ve observed over and over again: The people most concerned about outliving their money tend to be the least likely to actually do so. They stack conservative assumption upon conservative assumption – projecting higher-than-expected inflation, worst-case market returns, maximum sequence-of-return risk – and then underspend out of fear. They end up dying with too much money and too many unfulfilled dreams.” – Jordan Grumet
Thirty-First, he’s talking about translation here, but I think it applies broadly (edited to be more industry agnostic):
AI replaces average work. It can do average … faster, cheaper, and 24/7 better than you can. For many of you, it feels like a threat. … It’s good … and it’s going to get better. But it’s not great. So, the work ahead is not to fight AI. You cannot fight cheap and convenient, but you can dance with it.
I wanna start by talking about violinists. There were a lot of violinists in the 1800s ... if you wanted to hear some music, you needed to hire a violinist. There was no stereo, there was no streaming, there was no way to listen to anything unless you paid somebody to play it for you. We all know what happened, the record player showed up … the only violinists who are left are either people who play the violin ’cause they love it, or a few people who are playing at a completely different level, who are performing in a way that hearing it live is actually better than hearing a recording.
Race to the top. … When [you are] bringing something extra, something local, something magic, everyone benefits. … stand out … be the kind of person that would be missed if we are gone. I call that making a ruckus, showing up with generosity, and doing it in a way that we know you were here. That is the future for this industry.
Thirty-Second, is the Easterlin Paradox a hedonic adaptation or recalibration of the scale? According to this it appears to be some of both. If you want a much lighter take on this, I like Louis CK’s from 2011: Everything is Amazing & Nobody is Happy (particularly the portion from 1:58-2:30)
A good expansion of the concept of “the good life” is here (or here). It might be three pieces, not two. A good life might be one or more of: happy, meaningful, and (the new one) interesting.
A better balance of time and money might help too!
Thirty-Third, I’m not endorsing this view, just sharing it. (For example, ceteris paribus, housing starts being down is bullish for prices, not bearish. Also, prices don’t feed into CPI calculations, owner imputed rent does, though one of the metrics listed is “New Tenant Rent Index” which would figure into inflation.)
As I’ve pointed out for a long time (most recently here), real price appreciation is zero-ish; the returns come from rents. From Global Housing Returns, Discount Rates, and the Emergence of the Safe Asset, 1465-2024: “[The] real total return figure over the entire period [is] 5.9% p.a., of which 5.5% are rental yield returns, and just 0.4% p.a. result from capital gains.”
Thirty-Fourth, I couldn’t agree more with this: “Almost everything is downstream of integrity.” I also don’t think we have enough friction today, as noted here.
Thirty-Fifth, I remember all of this.
Thirty-Sixth, Kiplinger has five habits of the rich here. Most of them are pretty obvious, but I’m sharing it because I think a lot of people don’t sufficiently appreciate the power of the last one.
Thirty-Seventh, Morgan Housel has good observations and a new book.
Thirty-Eighth, excellent exposition around the questions we ask here. It also includes some alternative, perhaps better, questions.
Thirty-Ninth, I was talking to someone about business cycles recently. All the literature, the internet, the media, etc. thinks it looks like a sine wave (examples), but here’s what it really looks like:

Fortieth, two random things:
- NUA: We have a client where we’re going to employ an NUA strategy, and we were curious about how exactly the transactions are reported to the IRS. Custodians, etc. were useless, but Anitha found the answer here.
- HSA: You can withdraw within one year of death to reimburse expenses incurred prior to death. Many people “saving receipts,” and thus building up a large HSA balance, are worried about dying with a balance (which then is ordinary income and a 20% penalty to non-spouse beneficiaries). (source)
Forty-First, a few articles pertaining to college planning: 1 (or here), 2 (or here), 3 (or here).
Forty-Second, I’d call it the “one basis-point rule” but I get why they didn’t in this article (or here). The rule is, “If you are torn about making a purchase, you don’t need to stress about it if the amount of money at stake is 0.01% or less of your net worth.”
For someone with a net worth of $10 million that would be $1,000. That’s (to me) too much for a “don’t even think about it” approach, but what they are getting at is that it’s a tie-breaker if you are torn about the decision. From that perspective, I think it makes a lot of sense.
Forty-Third, a review of the options for diversifying concentrated positions is here. (There are other options, not listed, for those with charitable desires.) For why it’s important, see here.
Forty-Fourth, there are two pieces of career advice that I frequently give young people:
- Find the largest pile of money you can and stand as close to it as humanly possible; a portion is likely to fall off onto you. (I got this from a person who works at a family office.)
- Maximize your surface area exposed to luck. (Either I coined this, or I stole it so long ago I no longer recall doing so. Anyway, it’s a large part of the ethos of Financial Architects.)
Someone else just wrote almost exactly what I mean by the second one, and she even used the same phrase.
(Another version of the first idea is to find a place to work that has large profit margins. Life is much better when you aren’t fighting for, or over, nickels.)
Finally, my recurring reminder that J.P. Morgan’s updated Guide to the Markets for this quarter is out and filled with great data as usual.
That’s it for this quarter. I hope some of the above was beneficial.
If you are receiving this email directly from me, you are on my list of Financial Professionals who have requested I share things that may be of interest. If you no longer wish to be on this list or have an associate who would like to be on the list, simply let me know.
We have clients nationwide; if you ever have an opportunity to send a potential client our way that would be greatly appreciated. We also have been hired by some of our fellow advisors as consultants to help where we can with their businesses. If you are interested in learning more about that arrangement, please let us know.
We also offer a monthly email newsletter, Financial Foundations, which is intended more for private clients and other non-financial professionals who are interested. If you would like to be on that list as well, you may edit your preferences here.
Finally, if you have a colleague who would like to subscribe to this list, they may do so from that link as well.
Regards,
David
Disclosure
|