|
Financial Professionals Fall 2019
This is my quarterly missive intended primarily for my fellow financial professionals wherein I share items I have run across or thought about this quarter which I think might be beneficial to you. Enjoy!
First, I did not realize that the 2017 Tax Cuts and Jobs Act made some scholarships taxable to the students. Details here.
Second, there were several good pieces on value investing: here, here, and here, and a piece on factor misconceptions here. (Even Uncle Warren is struggling with value underperformance.)
Third, to accomplish something:
- Creative thinking is used to identify all the options
- Critical thinking is used to select one of them
- Constructive thinking is used to implement the one selected
Most of us spend way too much time on #2 when we should spend more on #1 and #3.
Fourth, great article here fleshing out the pitfalls of investing in directly owned real estate in an IRA.
I wrote a short version of this back in 2006 that I posted in 2016 on the blog, but the article above goes into detail. The relevant portion of my write up follows:
On a related note, we occasionally have people ask about purchasing real estate in their IRAs (individual properties, not REITs). We wouldn’t recommend buying real estate in an IRA for the following reasons:
- The fact that someone is using an IRA for the investment generally would indicate they don’t have the financial resources to buy it without using retirement funds. Since frequently most of an individual’s non-retirement assets are tied up in their primary residence (i.e. real estate), investing retirement funds in a similar asset in most cases would mean they are very undiversified (and possibly leveraged).
- Individually owned real estate (the buildings, not the land) can be depreciated for current tax savings and capital gains (above depreciation recapture) get a special (low) tax rate. Neither of these benefits are available within an IRA.
- Investors should avoid using leverage on IRA investments because it creates UBTI (Unrelated Business Taxable Income) which is taxed at trust (i.e. high) rates in the IRA. Further, this taxed income does not create any basis in the IRA and thus will be taxed a second time when it is distributed from the IRA to the owner. This is very unfavorable.
- Investors cannot use any “sweat equity.” Doing work on the property is an IRA contribution and prohibited since IRA contributions may only be made in cash.
- Using the property personally constitutes an IRA distribution and is taxable.
- Enough liquidity must be maintained within the IRA for unexpected expenses. Because the investor needs to avoid debt and thus UBTI and because they can’t just arbitrarily contribute extra funds to an IRA when needed, an adequate cushion of liquidity must be maintained.
- A similar need for liquidity exists in retirement when RMDs (Required Minimum Distributions) must be taken. There must be enough cash or other investments to make the distribution, or the taxpayer must distribute a portion of the property. For example, suppose a house is worth $548,000 and the taxpayer turns 70½. There is a 3.65% RMD so $20,000 of the house is distributed from the IRA and put into different (individual) ownership. Every cash flow is now split 96.35% and 3.65% between the two entities. Obviously, this creates a great deal of complexity.
- Related to the previous point, since RMDs are based on the value of the IRA, each year a qualified appraisal will have to be done each year to determine the current value.
Fifth, top performing teams have a mix of hard and soft skills as noted in detail here.
Sixth, good piece on confirmation bias here.
Seventh, good article on money and happiness here. Also, this from 2009, but I just came across it. Unsurprisingly (to me anyway), giving money to people who have financial problems doesn’t fix their financial problems. (Because, in my view, almost all financial problems are behavioral.)
Eighth, it’s the genes baby. People are more successful (i.e. have more money) mostly because of genetically inherited traits, as noted here. Money quote: “All of these results show that social transmission of SES, educational outcomes, etc., is mostly (or entirely) genetic.” Unpopular (and certainly not politically correct) view.
Ninth, there’s probably an investment lesson in this:

Is there an investment you like that “everyone” hates? It probably has a high expected return!
Tenth, some things won’t change in the wealth management industry.
Eleventh, as you may have seen, fee-based folks can now debit fees directly from the annuity just as you would from a 401(k), etc. and it won’t be considered a taxable distribution. I can’t find any of the original PLRs yet, but there are many news stories out including this one.
Twelfth, provocative paper was (see below) here. As they elucidate, extreme positive skewness of a very small number of individual stock returns might explain the outperformance of indexing (you own all the stocks so don’t miss the winner). The other interesting point (which they don’t make) is that if their account of the very short lives of companies is correct (and not recognized by investors) it would also explain the value premium (value stocks have a shorter duration than growth stocks – i.e. the cash flows are more front loaded). [Note: The author removed the paper from the SSRN site, but a synopsis of the paper may still be found here. I also have permission from the author to send you the original PDF, so let me know if you would like a copy.]
Thirteenth, a simple retirement strategy for the middle class:
- Delay SS claiming
- Only spend the RMD from retirement accounts
More nuance (but not really a lot more) in this paper from the Society of Actuaries.
Fourteenth, I read a few publications (Nautilus, Aeon, Quanta, Edge, Longreads, etc. and I print out hardcopy, I don’t read on a screen) just for general (if esoteric) education. I don’t expect anything to specifically apply to investing or financial planning (of course knowledge in general might indirectly lead to better wisdom in those areas), but Aeon just had a good piece I recommend.
(I also read the WSJ daily and the NYT Sunday for ideological balance – the physical papers because I’m old school – or perhaps just old. If you are wondering how I have time, I watch no – zero, zip, zilch, nada – TV for news or education.)
Fifteenth, clients return expectations are apparently pro-cyclical (i.e. after good (bad) market returns they have higher (lower) return expectations going forward) as academics found here.
To which all practitioners responded:

Sixteenth, I have long said that the S&P 500 is an active portfolio and when I am doing analysis on historical market data for myself, or where I think the audience for my results is other professionals, I use CRSP1-10 for “the market.” But when my audience is individual investors, I frequently use the S&P 500 because of its familiarity. So I am predisposed to agree with the author of this paper, but she is worried about not that much.
She repeatedly says things such as, “substantial effect” and “substantial amount of discretion” but also concludes from her calculations: “the discretionary portion of the S&P 500 represents roughly 5% of the total value of the index.” Now I don’t know about you, but if I had a portfolio that was required to be 95% indexed and I had control over 5% (and I was still restricted to profitable, large, U.S. companies and overall market cap weighting), I would certainly not call my control over the entire portfolio “substantial!”
Not only is the S&P 500 discretionary, but prior to March 4, 1957 it had only 90 constituents, not 500. Despite that, it really doesn’t matter. Here are various CRSP indexes (no discretion) vs. the S&P 500 from 1926-2018:
|
S&P 500 |
CRSP1-2 |
CRSP1-10 |
CRSP1 |
Correlation |
100.0% |
99.38% |
99.10% |
99.09% |
Monthly Sharpe |
12.36% |
12.04% |
12.16% |
11.86% |
Skewness |
0.3365 |
0.0657 |
0.13063 |
0.0168 |
Kurtosis |
9.7522 |
7.1277 |
7.54306 |
6.6086 |
CAGR |
9.99% |
9.48% |
9.75% |
9.28% |
Annualized Sigma |
18.64% |
17.56% |
18.29% |
17.25% |
As you can see, the S&P 500 is 99.38% correlated with CRSP1-2 (the largest companies in the U.S.) but still 99.1% correlated with the total market! (The largest companies dominate market-cap-weighted indexes.)
We also see that while the S&P 500 has had the best return, it also had the highest volatility – but the Sharpe ratio is still the highest. An actual investment in the CRSP 1-10 would have worse performance because of the higher trading costs (especially historically) of small cap stocks. Also, CRSP 1-2 has fewer stocks than the S&P 500 and since smaller companies are more volatile, that is (probably) why the standard deviation of the S&P 500 is higher than CRSP1-2. Also notice that the S&P 500 is more skewed (positively) than the CRSP indexes, and it has higher kurtosis (fatter tails). Those two things in combination are nice for investors.
I would call any of those indexes valid, but the odds that the mean return of the S&P 500 is different from CRSP1-2 (two-tail test) is 99.45% (we have 1116 monthly observations!). The odds that the mean return of the S&P 500 is different from CRSP1-10 is just 72%. In other words, there is no statistically significant difference between average monthly return of the S&P 500 and CRSP 1-10.
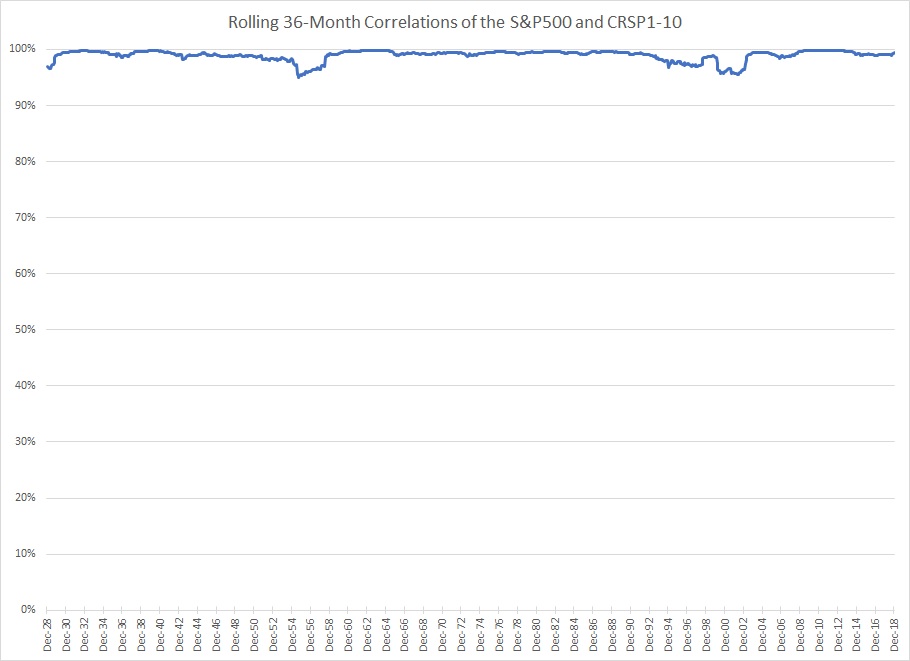
Here is a graph of the rolling 36-month correlations of the S&P500 to CRSP1-10(showing the origin because I hate chart crimes):
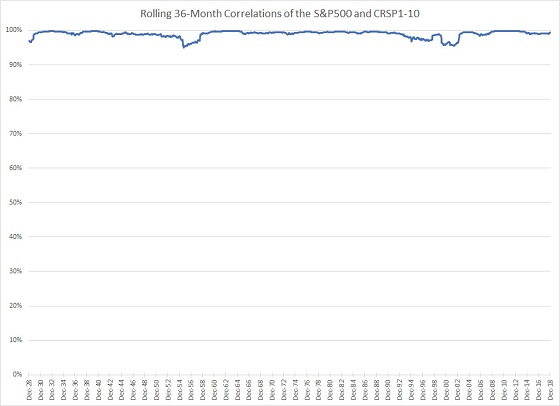
The drops in correlation may interest you. The first one is caused by the S&P 500 outperforming CRSP1-10 by a little more than 2% in September 1954 and then underperforming by about the same amount in February 1955. (I don’t know why.) You see three years later a spike up as those months drop out. Similarly, after slight reduction in correlations in the tech boom era, in February 2000 the S&P 500 underperformed CRSP1-10 by almost 5% and then outperformed by more than 4% the next month. (A few very large companies took big hits relatively and then the whole market recovered the following month but the large companies even more.) Again, there is a spike in correlation three years later when those two months drop off.
Seventeenth, a client who is an attorney passed this along to us: What Dead Celebrities can Teach us about Estate Planning. (If you need some help with fiduciary litigation – i.e. disputes over wills, trusts, estates, guardianships, and conservatorships – he’s your guy). He went to an estate planning CLE (though he isn’t an estate planning attorney) and commented, “Although this is a little dated (I think last updated in 2016), it’ s fascinating.”
I thought it was very good (though repetitive) as well. A good mix of the “soft” stuff as well as some technical issues – particularly helpful as it mentions many areas where state laws differ (sometimes significantly). I don’t think most financial planners realize how state-specific estate planning is. The CFP exam just covers the basics and never talks about laws in specific states – apart from generalities about community property vs. common law. I just read the entire thing and commend it to you as well.
Eighteenth, structured products are still atrocious. Paper here and synopsis by Swedroe (with additional resources) here. Short version: The expected return (due to high costs) is negative.
Nineteenth, good commentary on risk tolerance here. (I covered my version recently here.)
Twentieth, my consulting clients don’t send me stuff to read very often, but one day two people did (different firms). The pieces aren’t the same, but the themes certainly rhyme. I don’t have any conclusions, but I thought they were worth sharing with everyone:
From Robin Wigglesworth at the FT: Japanification: investors fear malaise is spreading globally
From Ray Dalio at Bridgewater: Paradigm Shifts (PDF)
Twenty-first, I don’t want to get into political issues, but I thought Do Immigrants Threaten U.S. Public Safety? worth sharing. Regardless of your political affiliation, and despite the current truth-challenged environment, I hope we can agree with Daniel Patrick Moynihan’s (attributed) bon mot: “Everyone is entitled to his own opinion, but not his own facts.”
Twenty-second, your portfolio should be like Costco.
Twenty-third, as the cliché goes, “demography is destiny” and I know I have looked at China’s growth vs. the U.S. before, but it’s been a while and I didn’t remember the conclusion. Anyway I pulled data from World Population Review for the four countries that will have the largest populations in 2095 (as far as the data goes out).
India, China, and Nigeria currently have 4.2, 4.3, and 0.6 times the U.S. population respectively, and 11.9, 4.2, and 6.3 times the population density respectively. The U.S. simply isn’t very crowded!
In 2095, India, China, and Nigeria are projected to have 3.5, 2.5, and 1.7 times the U.S. population respectively and 9.9, 2.5, and 16.8 times the projected population density respectively. Perhaps we allow more immigration, but require those immigrants to settle in Alaska, Wyoming, Montana, North Dakota, South Dakota, New Mexico, Idaho, Nebraska, Utah, Kansas, etc. (The population densities of all those states – in people per square kilometer – are 0, 2, 2, 4, 4, 6, 7, and 9. India, China, and Nigeria are 420, 148, and 223 respectively. The U.S. overall is 35.)
The U.S. in 2095 will be 1.3 times as dense as it is now and will have about 100 million more people. That sounds like a lot of growth, but it’s over 75 years. We added the last 100 million people in the last 40 years (i.e. since1980).
Current per capita GDP, using PPP, and averaging the IMF and World Bank figures, are $8,473; $17,626; $5,665; and $61,632 for India, China, Nigeria, and the U.S. respectively. If each country had per capita growth just 2% higher than the US, their per capita GDP would match the U.S. in 100, 63, and 121 years. But 2% higher isn’t likely over that long a period (even if much more than 2% is reasonable in the short run). As less developed countries develop, their growth rates converge to the developed average (as do birth rates.)
Also, while we’re on the subject of demographics, I saw interactive maps of America’s expanding racial diversity and how people make and spend money by age.
Twenty-fourth, Larry Swedroe had a good summary of the research on private equity here. I have collected research on VC and PE investing over the years as well (some of which overlaps with Larry’s):
- The Returns to Entrepreneurial Investment: A Private Equity Premium Puzzle (2002)
- The risk and return of venture capital (2003)
- Private Equity Performance Returns: Returns, Persistence, and Capital Flows (2005)
- Performance of Private Equity Funds (2005)
- Investing in Private Equity Funds: A Survey (2007)
- We Have Met the Enemy and He is Us (2012)
- Limited Partner Performance and the Maturing of the Private Equity Industry (2013)
- Private Equity (2013)
- When Private Equity Goes Public (2013)
- How persistent is private equity performance: Evidence from deal-level data (2015)
- Replicating Private Equity with Value Investing, Homemade Leverage, and Hold-to-Maturity Accounting (2017)
Twenty-fifth, I have thought for years that not only are real estate commissions unconscionably high, but the structure is wrong. At 3% (gross to selling agent), they have an incentive to sell quickly, but not for the most money. If they got an extra $10k out of it by taking an extra month, that is just $300 to them, but $9,300 to the buyer (6% total commission). I’d want to wait the month! If I could structure the deal, I would determine the “fire sale” price that would sell the house immediately, then if an agent wants to split everything above that 50/50 (but nothing on the initial piece) our interests are much more aligned.
I also do think there is collusion by the buying agents to not show any house that doesn’t offer them the “standard” 3%. When we sold our last home, I paid $99 for the listing plus 3% to the selling agent, otherwise people wouldn’t look at it. It baffles me. Before we “listed” it a young couple liked it and wanted to make an offer (they found it themselves on Zillow where we had listed it FSBO) and they went and got an agent – why would you do that? They were wasting 3% of negotiating room! (For unrelated reasons they ended up purchasing a different house.)
Anyway, the Economist has an article on the collusion.
Twenty-sixth, are you in the 1%? This lets you look at your state.
Twenty-seventh, when it comes to investing, stay the course.
Twenty-eighth, I have written about advisor alpha/gamma/sigma before and Vanguard has a slightly different piece exploring related topics (here).
To summarize, they find that a professionally advised client improves their portfolio in the following ways:
- Reduced cash allocation
- Increased international diversification
- Increased passive holdings (this may be specific to the Vanguard clients though)
- Reduction of concentrated positions
My guess is that unadvised clients also would have a growth (vs. value) tilt to their portfolios as well.
Russell also just put out a piece about the value an advisor adds (here), which to my mind double-counts the value added in the categories. (I also have to say I am disappointed they didn’t use a Greek letter to describe it!) In other words, by paying an advisor the client gets higher returns from better rebalancing (0.10%), fewer behavioral errors (1.90%), and less tax drag (1.52%). To also count the 0.33% a “robo” would charge and 0.78% for planning implies that there is no rebalancing/behavioral/tax advantage from either of those.
Twenty-ninth, very interesting paper (in two parts: I & II, summary here). They balance Jeremy Siegel’s overly optimistic view of stocks with what appears to be better data. Highly recommended. A few observations:
- This is why our most aggressive allocations are 80/20 stock/bond and why on average our clients are 60/40 – there is a very real possibility of bonds outperforming even over long horizons.
- In the data, bonds underperformed in the highly inflationary environments and outperformed in the deflationary ones, but since we use TIPS for a significant portion (50% typically) of the bond allocation our clients should be unaffected by either.
- I’m not sure the 19th century environment is all that relevant today, but (as I am fond of observing) history is not very useful for learning what will happen, but it is very useful for learning what can happen.
This data would explain the ERP “puzzle.” I sent this out a few years ago: “In that time period, the premium for stocks over bonds was 6.5%. Risk aversion models are unable to explain why it should be so high. (This is frequently called the Equity Premium Puzzle.) In the 1996 paper The Equity Premium: It’s Still a Puzzle the authors posit 3.5% as the maximum…”
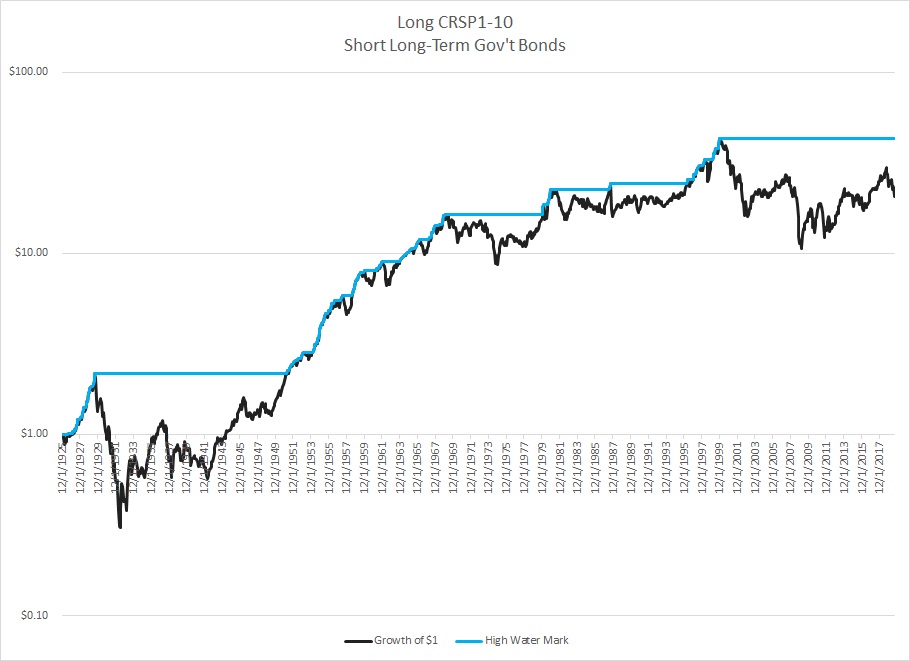
To further illustrate the point in the paper, I whipped up a graph showing a hypothetical long-short portfolio where you are long the U.S. stock market (CRSP 1-10) and short long-term gov’t bonds using the good data we have from 1926 on (through the end of August 2019):
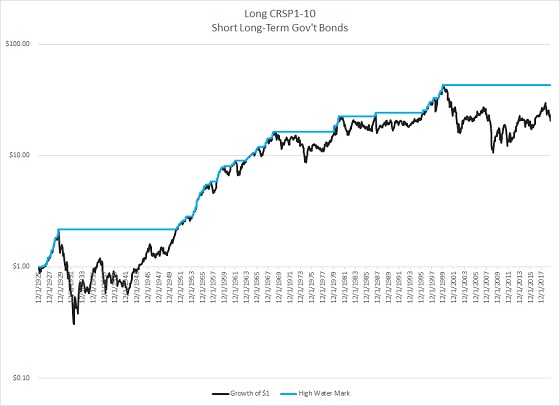
As you can see, the stock investor has merely tied the long-term bond investor for the last 22 years. Furthermore, from the high point on that chart (12/1999), the bond investor has a compound return of 7.95% vs. 6.27% for the bond investor. Stocks for the long run?

Finally, my recurring reminders:
J.P. Morgan’s updated Guide to the Markets for this quarter is out and filled with great data as usual.
Morgan Housel and Larry Swedroe continue to publish valuable wisdom. Just a reminder to go to those links and read whatever catches your fancy since last quarter.
That’s it for this quarter. I hope some of the above was beneficial.
Addendum:
If you are receiving this email directly from me, you are on my list of Financial Professionals who have requested I share things that may be of interest. If you no longer wish to be on this list or have an associate who would like to be on the list, simply let me know.
We have clients nationwide; if you ever have an opportunity to send a potential client our way that would be greatly appreciated. We also have been hired by some of our fellow advisors as consultants to help where we can with their businesses. If you are interested in learning more about that arrangement, please let us know.
We also offer a monthly email newsletter, Financial Foundations, which is intended more for private clients and other non-financial-professionals who are interested. If you would like to be on that list as well, you may edit your preferences here.
Finally, if you have a colleague who would like to subscribe to this list, they may do so from that link as well.
Regards,
David
Disclosure
|