|
Financial Professionals Winter 2020
This is my quarterly missive intended primarily for my fellow financial professionals wherein I share items I have run across or thought about this quarter which I think might be beneficial to you. Enjoy!
We currently have three consulting clients (RIA firms) and can accommodate two more. Firms look to us for guidance and to serve as a sounding board. For example, we are often a source of:
- Perspective in times of market volatility
- Counsel on new situations (TCJA, SECURE Act, negative interest rates, etc.)
- Expertise on tax-efficient investing (asset location, etc.)
- Solutions for valuing pension payout options and employee stock options
- Advice on asset allocations and portfolio implementation
The annual retainer for this is the square-root of your AUM – it’s on-brand!
For more details or to discuss further, please e-mail me or call 770-517-8160. – David
First, I saw a good exposition of one type (premium-financed, indexed, universal life policies) of insurance sales shenanigans here.
Second, Bob Keebler has a “Top 40 Tax Planning Opportunities For 2019” e-book. I’m not plugging the book (it’s probably good, but I haven’t read it), but the table of contents (listed here) itself is a very good list of strategies to be familiar with. Even if you don’t buy the book, I assume you could just research the ones you are unfamiliar with.
Third, the Editor’s Letter from some recent editions of the Alternative Investment Analyst Review are excellent and illustrate recency bias (aka performance chasing). See here and here (login required for the second link).
Fourth, I found this article on business models interesting: Terrible Business Plans, Wonderful Businesses (also see Simple Business Models).
I wonder what weird business model in wealth management we’re overlooking …
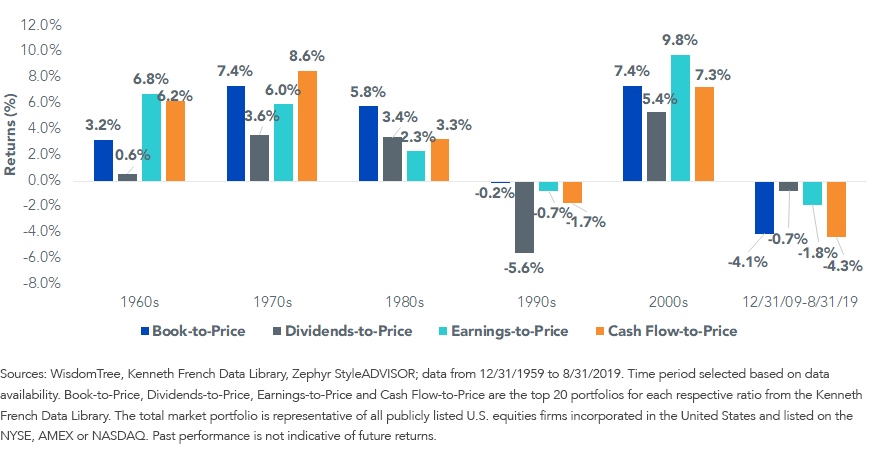
Fifth, a few items on value investing:
Of course we don’t know in advance which will work best going forward, but this is interesting to see:
Sixth, a few of my consulting clients (see the top of this message) have asked me for thoughts about negative interest rates. I don’t think I have any great insight, but it makes me feel just slightly better that Howard Marks apparently doesn’t either (see here).
I have a few, very tentative and provisional thoughts:
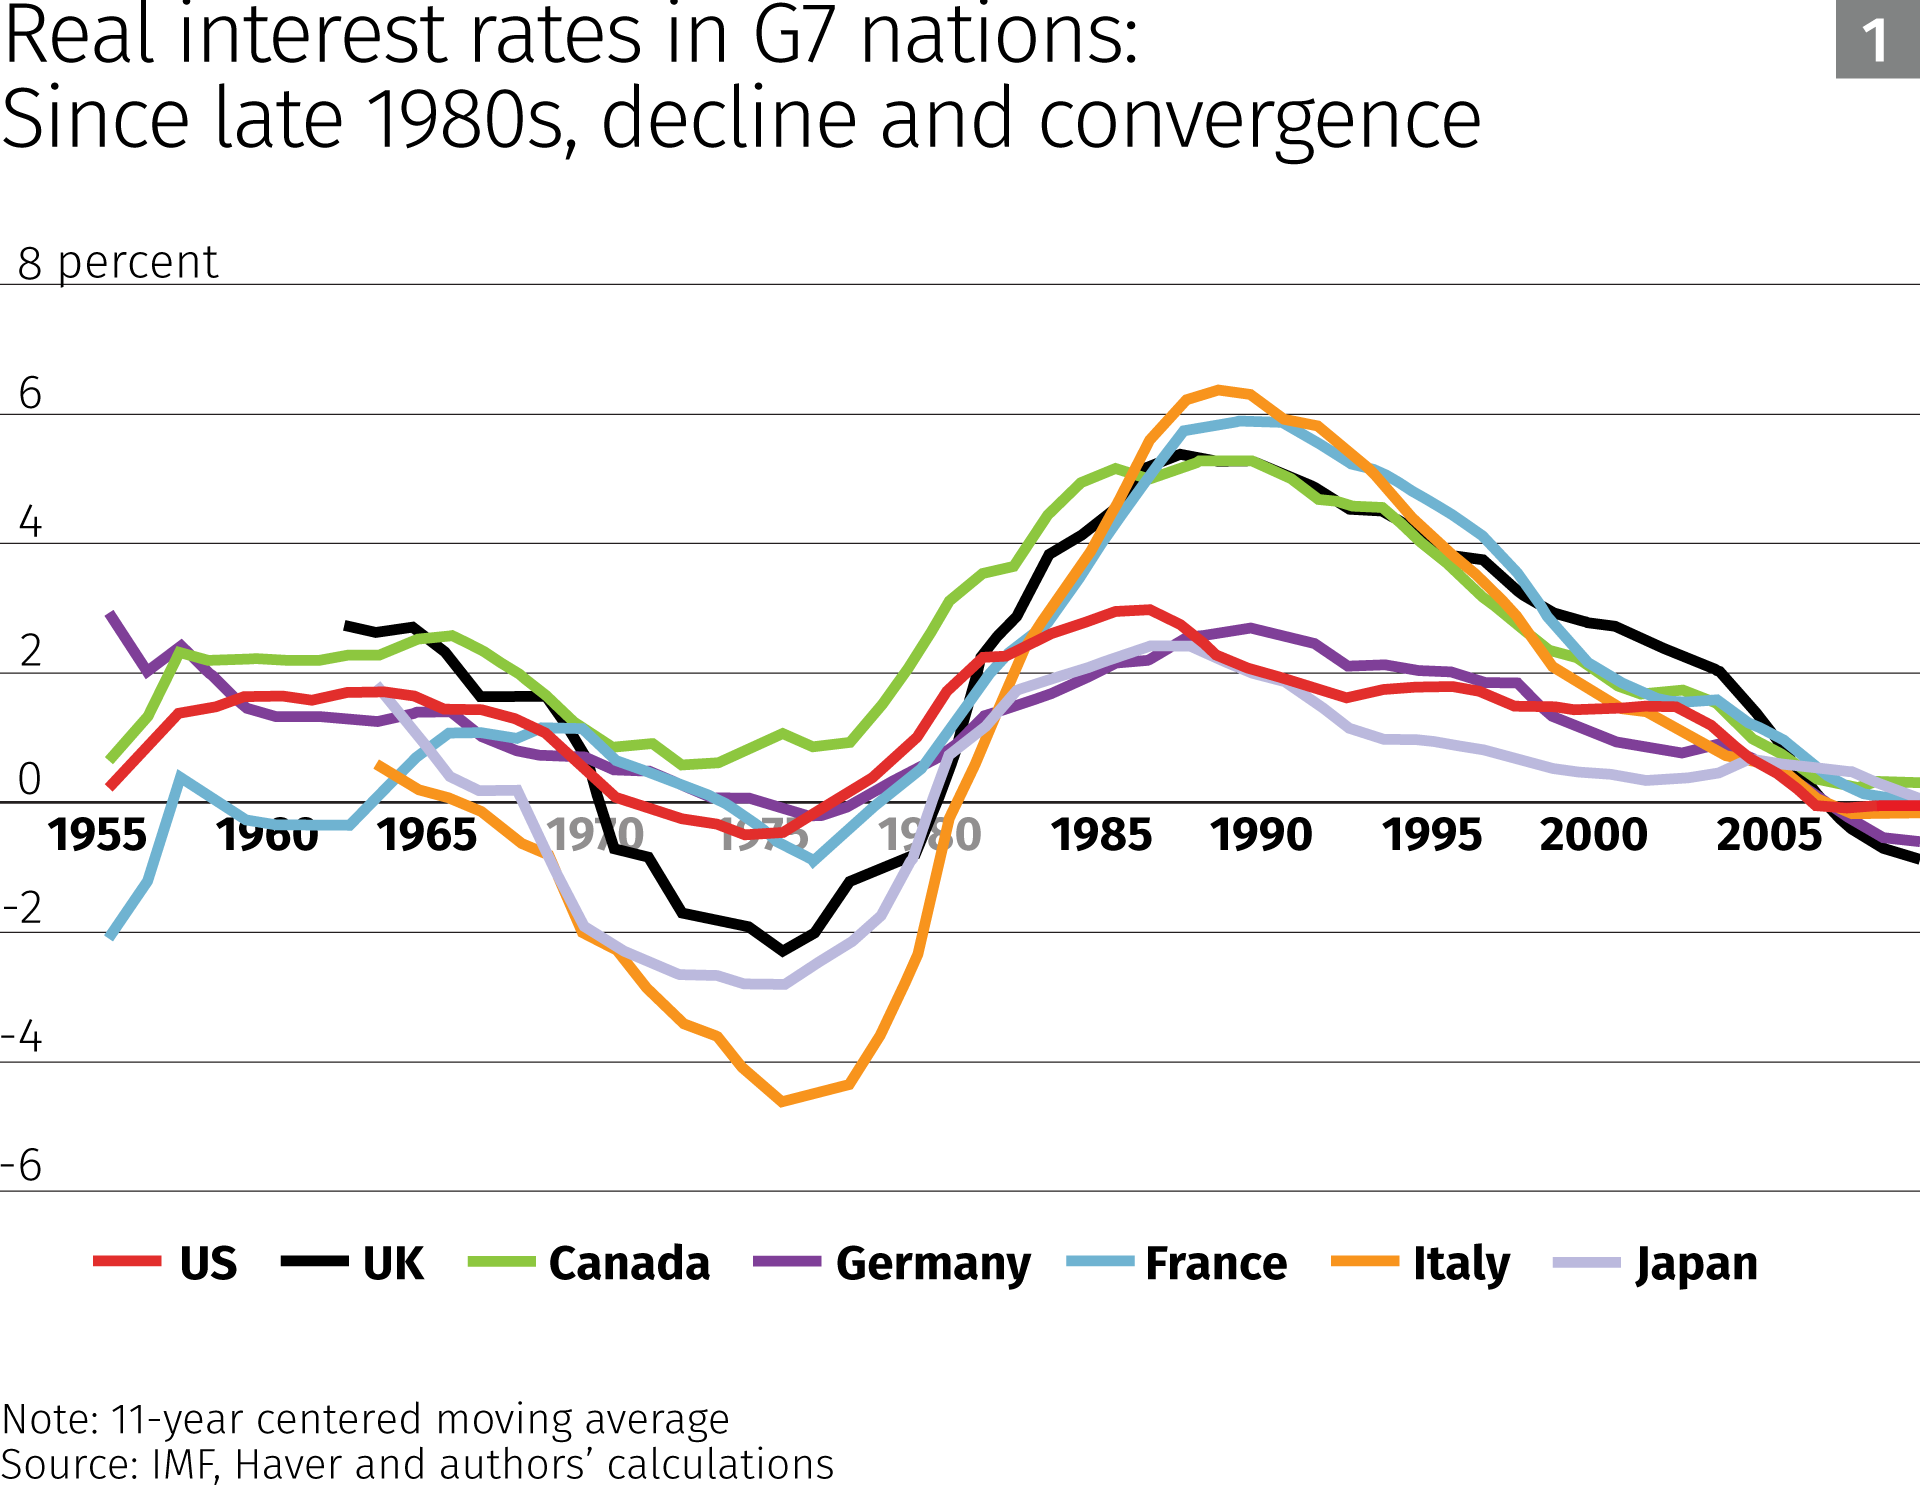
First, I always think in terms of real (rather than nominal) returns. While negative nominal rates are a novel development, negative real rates have certainly been experienced before (source):
Second, if real rates continue to be low, then longer-duration assets are more favored (ceteris parabis). In other words, value (short duration) is disfavored compared to growth (longer duration). More generally, stocks (longer duration) are more favored to bonds (shorter duration). (Stocks have infinite maturities, but finite durations and while some bonds don’t mature (consols) they also have a duration which in theory could be longer than stocks, but it would be very unusual.)
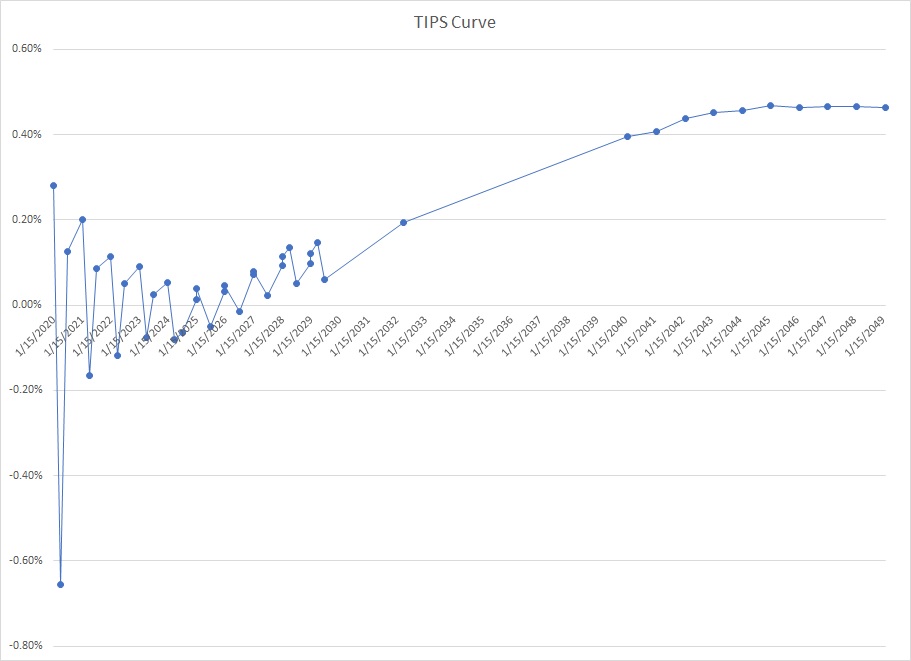
Third, if the yield curve has a normal shape, but is merely lower than historically has been the case, I’m not sure that means anything. Here is the yield curve from TIPs recently (data source):
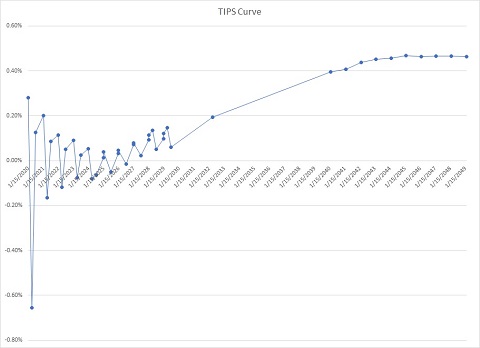
The reason the left side is “choppy” is because in the event of cumulative deflation TIPS are guaranteed not to pay less than the original amount at maturity. Bonds which were issued at different times can have floor amounts that are closer (lower yields) or farther away (higher yields).
Seventh, the widespread adoption of zero (equity) commissions and the soon-coming (apparently) fractional shares has me thinking we may see direct indexing sooner rather than later. I am also very interested to see what limits or costs Schwab puts on their fractional share program and if other firms follow them as quickly as they did on zero commissions.
- Could I put $3,000 in a Schwab brokerage account and direct them to purchase $1 each of every stock in the Russell 3000? (That would be a direct-indexed equal-weight Russell 3000.)
- Regardless of the dollar amount, if I want to actually do a trade like that will it be possible to automate? I don’t want to manually place 3,000 trades!
- Can I replicate an index without paying index fees? In other words, the holdings of the S&P 500 or whatever index are public info (with a lag maybe, just by looking at the holdings of an index fund based on it), and if I wanted to set up an index fund based on that I would have to pay licensing fees. But I can just look at the holdings and replicate it for free (retail anyway) without paying the licensing fees (i.e. no expense ratios) with direct indexing.
- Suppose I do the direct-indexed equal-weight Russell 3000, can I also do daily rebalancing back to target? Think of the explosion of trading volumes this might create!
Another thought on this (h/t Rex Macey): Since dividends are even (penny) amounts per share, what will happen to the fractional dividends?
In other words, if Schwab (or whoever) rounds off then on average Schwab passes along the full dividend to account holders (when they round down Schwab wins, when they round up Schwab loses, and you would think they should balance out over time). But if Schwab rounds down (truncates) all the time they can siphon off a lot of money (maybe).
It’s like Richard Pryor in Superman III (aka salami slicing).
Let’s see how lucrative this would actually be. You might think the average fractional amount will be 0.5 cents (if you have amounts occurring randomly from zero to one, they would average ½). So for every fractional position (not share), for every dividend issued, the custodian could collect ½ a cent. Per Wikipedia, Schwab has 10,755,000 active accounts. If each one held one fractional holding, and dividends were paid quarterly, then Schwab would make 10,755,000 * 4 * $0.005 = $215,100/year. If each account has two fractional share positions, you would double that, etc. Unless people start having a lot of fractional shares (like my 3,000 positions of $1 each above) then this really doesn’t do all that much for the custodian’s bottom line.
That math, though intuitive, is wrong. Remember Benford’s Law. My ½ cent estimate is too high. I was correct, “if you have amounts occurring randomly from zero to one, they would average ½” but the amounts wouldn’t evenly occur from zero to one. The average amount the custodian would get from truncating would be just 0.3441 cents per dividend paid, not 0.5000 cents. But even if they round they win (a little) because they will round down a little more than up. With rounding they would still get 0.0431 cents per dividend paid. 10,755,000 * 4 * $0.000431 = $18,543 per year revenue even if rounding if the average account has one fractional share position that pays a quarterly dividend, so multiply by however many fractional positions with dividends you think the average (not median) will be in accounts.
I’m sure more oddities will occur to me, but this looks like it might lead to very interesting changes in the market.
Eighth, periodically I hear an advisor or (more commonly) a wholesaler defend active portfolio management with active share. I knew this was debunked, but I didn’t realize how thoroughly! Since I saw most of the papers one at a time, I didn’t realize how many there were.
Ninth, skill stacking is important for career success. See How to Become the Best in the World at Something. William Bernstein had a version of this in the intro to from The Investor’s Manifesto (2010):
Successful investors need four abilities. First, they must possess an interest in the process. It is no different from carpentry, gardening, or parenting. If money management is not enjoyable, then a lousy job inevitably results, and, unfortunately, most people enjoy finance about as much as they do root canal work.
Second, investors need more than a bit of math horsepower, far beyond simple arithmetic and algebra, or even the ability to manipulate a spreadsheet. Mastering the basics of investment theory requires an understanding of the laws of probability and a working knowledge of statistics. Sadly, as one financial columnist explained to me more than a decade ago, fractions are a stretch for 90 percent of the population.
Third, investors need a firm grasp of financial history, from the South Sea Bubble to the Great Depression. Alas, as we shall soon see, this is something that even professionals have real trouble with.
Even if investors possess all three of these abilities, it will all be for naught if they do not have a fourth one: the emotional discipline to execute their planned strategy faithfully, come hell, high water, or the apparent end of capitalism as we know it. “Stay the course”: It sounds so easy when uttered at high tide. Unfortunately, when the water recedes, it is not. I expect no more than 10 percent of the population passes muster on each of the above counts. This suggests that as few as one person in ten thousand (10 percent to the fourth power) has the full skill set. Perhaps I am being overly pessimistic. After all, these four abilities may not be entirely independent: if someone is smart enough, it is also more likely he or she will be interested in finance and be driven to delve into financial history.
But even the most optimistic assumptions – increase the odds at any of the four steps to 30 percent and link them – suggests that no more than a few percent of the population is qualified to manage their own money. And even with the requisite skill set, more than a little moxie is involved. This last requirement – the ability to deploy what legendary investor Charley Ellis calls “the emotional game” – is completely independent of the other three; Wall Street is littered with the bones of those who knew just what to do, but could not bring themselves to do it.
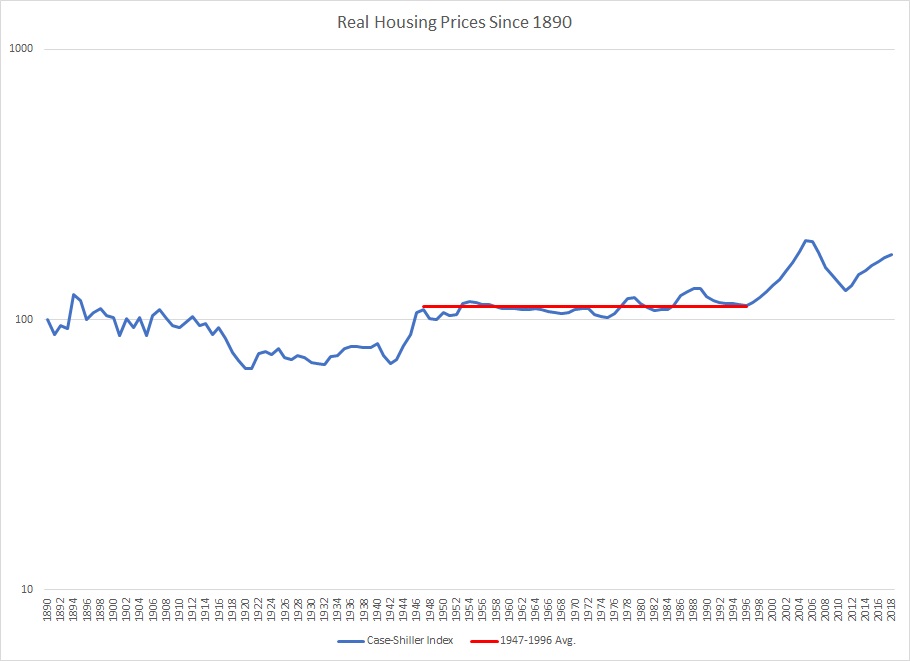
Tenth, it’s been a while since I looked at housing data so I took a look at the Case-Shiller data: US Home Prices 1890-Present) and made a graph. This graph is inflation-adjusted and uses a log-scale so the magnitude of moves should be the same throughout – there are no chart crimes here:
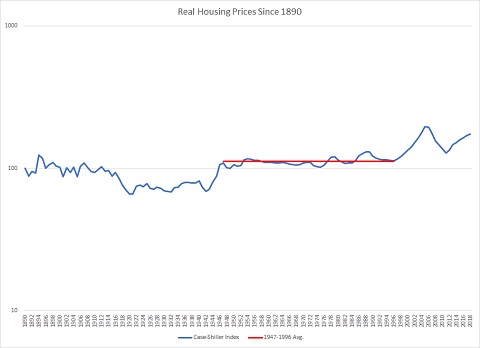
For 50 years post-WWII, housing prices had a standard deviation of just 6% around the mean value. Starting in 1997, something changed either structurally or psychologically. The current value is over 9 standard deviations (56%) above that mean. In other words, housing prices would have to decline 36% to get back to that 50-year average.
Just sayin’ …
Another way of looking at it is for 106 years (from 1890 to 1996) the average annual real price appreciation on houses was 0.1% (i.e. about zero). For the last 22 (1996-2018) it has been 2.0%.
Eleventh, a few quotes:
“Always remember that there are so many gurus because charlatan is so hard to spell.” (source)
And here are many good quotes by Peter Bernstein.
Twelfth, Morgan Housel had a good piece on The Spectrum of Wealth.
Thirteenth, I’ve been thinking about factor anomalies.
Fischer Black (of Black-Scholes option pricing fame) said, “we might define an efficient market as one in which price is within a factor of 2 of value, i.e., the price is more than half of value and less than twice value.” (Full paper where that quote occurs is here.) That doesn’t sound very efficient to me, but perhaps the point is that a market can be “efficient” without being particularly accurate. What would this mean in practice?
First, it would mean that the level of prices wouldn’t tell you all that much about the expected returns for a stock. Indeed, as Rob Arnott has pointed out, if there are pricing errors, then market-cap-weighted portfolios are systematically overweight the overvalued and underweight the undervalued (though of course we don’t know the “true” values of any particular security until later). An easy proof of this would be an equally-weighted portfolio would tend to outperform, and of course that has been true historically (though the performance is “explained” by value exposure, but maybe we have the causation backwards). Another way to look at this is Stock A with a market cap double that of stock B would get twice the weight in a portfolio but most portfolio managers would not assume an expected return that is higher, never mind twice as high. In other words, if I am going to devote double the resources to an investment doesn’t that imply I find it twice as attractive (risk adjusted)? Active managers do that with portfolio investments, advisors do that with active managers and asset classes, etc. why do we not do it with passive investments? (The answer, I think, is that historically this led to such high turnover that transaction costs killed you. That is no longer true, but I think we haven’t updated our portfolio design paradigms.)
Second, while the level of prices maybe isn’t particularly informative as to expected return, maybe the movement of prices is useful. Even if the level of prices doesn’t tell you all that much it must be true that prices are, however imperfectly, approaching accurate prices. They have to stay within that more than half less than double range. It’s a supply and demand equilibrium: we all learned in basic economics that prices are never right, but they are always approaching right. This would mean that momentum investing would work, and of course that has been true historically as well.
So the two biggest factor anomalies are perhaps just another way of saying prices have errors but the market is always working to correct them. But it isn’t instantaneous so value and momentum both work, the first by not overweighting a price that has error in it and the second because that error is decreasing over time.
If it’s really that equal-weight beats market-cap-weight that is doing all the work on value, what would happen if you went to the next level? In other words, imagine just three securities with the weights 1, 2, and 3. Equal weight would be 2, 2, 2. The opposite of market cap would be 3, 2, 1. In other words, opposite of market cap, when combined with market cap would be equal weight. Would that do even better? And you can go further with 4, 2, 0; 5, 2, -1; etc. Doing this gives you arbitrarily large amounts of “value” (and small-cap) exposure (I think) with no information other than market caps. I would love to see how portfolios like that would have performed historically. (To remove the small cap effect, it would be interesting to see what the effect would be just within size deciles.)
Just like there are “completion” indexes to the S&P 500, there could be balancing indexes weighted so that when combined with market-cap-weighted portfolios the combination is equal weighted in aggregate.
Fourteenth, in light of zero commissions on equity trades I was thinking about the custodian business and I had a thought that is new (to me at least). The value to a custodian of an institutional (RIA) client is that they get to externalize lots of their support function – for free! In other words, while an RIA will lower custodian revenue (by keeping trading volumes and cash balances for a client lower than they would be if the client were directly with the custodian – and thus lower payment for order flow and revenue from cash spreads) they also lower the custodian’s costs by doing lots of the support instead of the custodian having to do it.
If the X clients that an RIA services were direct retail with the custodian, the custodian would probably have to add more retail support than they would save in institutional support. In other words, our expertise in helping clients fill out paperwork, etc. saves the custodian in employee headcount net of the support people for us. At an RIA of some size, there is probably at least one person on the RIA’s payroll that is really doing what would otherwise be the custodian’s work! If we offered no help and told all of our clients to just call the custodian how many people would the custodian have to hire to support those folks vs. how many institutional support people would they be able to eliminate from not taking our calls anymore? I am very sure it would cost them more to handle the first than they would save on the second. So we are actually (in part) doing the custodian’s support function for free (to the custodian).
Fifteenth, wealth inequality is a contentious topic so objective data is nice. The graphs from the St. Louis Fed look like solid figures to me. They use medians, which is appropriate. The only quibble I could have is the first chart is pre-tax which is misleading (potentially, depending on the point you want to make). Net of transfer payments (taxes on the high income and benefits to the low income) the graph would not be nearly as skewed, but I’m not sure what the comparison from 1989 to 2016 would be on a net basis. Taxes on earned income have gotten more progressive (top bracket was 28% in 1989 and is 37% plus 0.9% now), but less progressive on investment income (capital gains and dividends are lower now because there wasn’t a special cap gains rate in 1989, it was the 28%), and incomes have moved too (as they show) which would undo some of it so as far as net spendable income, so bottom line I’m not sure.
This article as well as this one (both from The Economist) are excellent as well.
Also see this … and this. (Be sure to scroll down, wow!)
Sixteenth, you can’t forecast complex adaptive systems (like the economy or market) so don’t be guided by economic forecasts. Also, see Do Any Economists Have Superior Forecasting Skills? Here are the main conclusions:
- Economists can forecast in aggregate
- Economists individually can’t beat that aggregate forecast (except by luck)
So let me add a few things:
- The market has undoubtedly incorporated the average economic expectation.
- Therefore, economic forecasts will not lead to superior investment returns.
In short, since there are no “star” economists (those who can forecast better than the collective average) there is therefore no ability to beat the market by closely following any of their opinions.
Seventeenth, good college ranking data here.
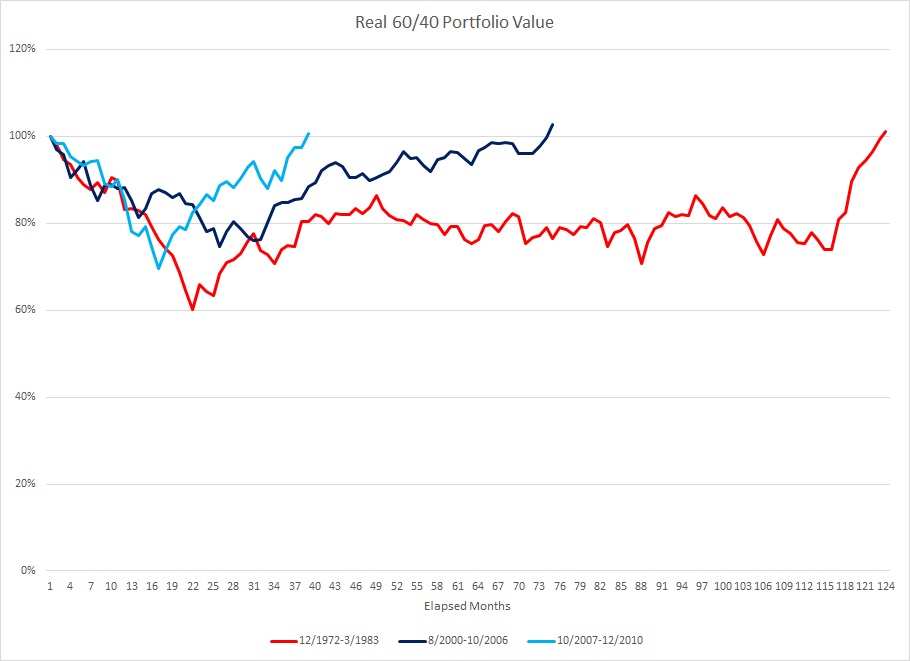
Eighteenth, I graphed the real value of a 60/40 portfolio over the past three significant stock-market downturns. 60% was CRSP 1-10 (i.e. total stock market), 40% was five-year treasuries, the portfolio was rebalanced monthly, and it’s adjusted for CPI (important when including the 1970s).
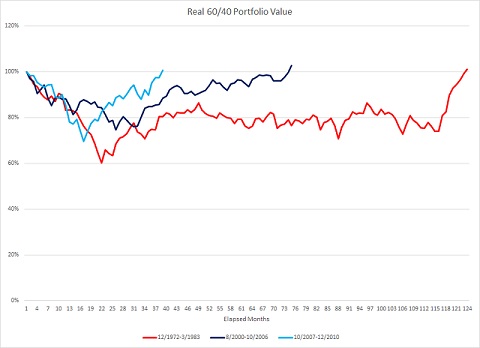
As you can see the most recent correction, far from being a calamity, was a “nothing burger” for a well-diversified investor (40% 5-year treasuries) as far as the purchasing power of their portfolio. Investors were back to even in 38 months, vs. 74 and 123 in the previous two downturns.
Nineteenth, vice-chair of the Federal Reserve, Richard Clarida, had excellent analysis of low interest rates here.
Twentieth, there’s always something to worry about:
“95% of days are in a state of drawdown”
“almost half the time stocks are in a double-digit drawdown throughout history”
“eventually one of these all-time highs will be THE all-time high that will remain in place for some time. And those long clusters of highs can be followed by periods like the 1970s or 2000s where stocks rarely hit new highs because they were littered with nasty bear markets.”
Twenty-first, the standard deviation of intelligence appears to be increasing. Interesting.
Twenty-second, commenting on race and wealth these days is risky, but this new paper from the Boston Fed I thought was good. Here are some items (with some comments from me) that I thought were interesting:
- “Median net worth in 2016 … was $163,000 for white families, $16,600 for black families, and $21,500 for Hispanic families.” (That’s terrible for everyone!)
- “In 2016, the mean net worth of white families was $904,000, compared to mean net worth of $140,000 for black families, and $182,000 for Hispanic families.” Since there is positive skewness, averages are much higher than medians, but notice that the most skewed – measured by just dividing the average by the median – are the black and Hispanic families.
- “Mean assets in 2016 were $1 million for white families, $196,100 for black families, and $247,000 for Hispanic families.” (Again, remember skewness.)
- “[W]hile white families had mean assets that were roughly five times as great as those held by nonwhite families, the mean debt levels of white families were only double the amount of their nonwhite counterparts.” (I.e. on a percentage-of-net-worth basis, white families have less leverage.)
- “The median net worth of white families with heads aged 55 to 64 [was] $275,000 in 2016.” (These are people about to retire and this includes home equity. This generates about $11k/year on the 4% rule. The median home value in the U.S. is roughly that number so you could also look at this as the median family about to retire has the equivalent of no mortgage and little else.)
- “[T]he average net worth for homeowners is more than 400 percent higher than for those families not owning homes, conditional on controlling for all of the other factors. Controlling for homeownership reduces the coefficient on being white by 47 percent … By itself, homeownership is, of course, correlated with race.” So being a homeowner helps a lot but it may not be causal. In other words, people who are more squared away in general may tend to be homeowners – it isn’t necessarily the homeownership that causes them to have higher net worth.
- “[T]he white-black wealth gap, conditional on including a covariate for homeownership, is almost entirely due to differences in asset accumulation. The wealth gap that exists between Hispanic and black families is more evenly split by differences in assets and debt, but is mostly due to Hispanic families having less debt than black families.” There have been other studies that showed that if your “group” (here racial) is lower-net-worth, then successful members of the group spend more on conspicuous consumption to signal that they are better than their group. This reduces net worth obviously.
- “Families that are risk tolerant and those with longer planning horizons have higher net worth, while families that are comfortable with the idea of borrowing money to fund vacations have lower net worth.” (Duh.)
- “Residential real estate accounts for a large share of the total wealth of nonwhite families, and low-wealth families are relatively highly leveraged on their real estate holdings. As a result, booms and busts in home prices have a disproportionate effect on low-wealth, highly-leveraged homeowners.”
- At lower net worth levels, the variables they controlled for explained all the racial disparities, but explained less as net worth increased.
- “[O]bservable factors (including usual income and homeownership) fully account for the white/Hispanic wealth gap at the mean of the distribution, and explain between 70 and 89 percent of the white/black wealth gap.”
Twenty-third, the topic of Qualified Charitable Distribution (QCD) vs. Donation of Appreciated Securities (DAS) was just written up very well in the Journal of Financial Planning. Assuming the taxpayer has the choice of either (i.e. they are over 70½ and have securities with long-term capital gains) here is my simplified flowchart version of the optimal choice:
- Does the taxpayer itemize?
- No, not even with the prospective DAS → QCD
- Yes, or only with the prospective DAS → go to next question
- Is the taxpayer’s LTCG rate greater than 0% (including no future step-up)?
- No → QCD
- Yes → go to next question
- Is the taxpayer subject to SS or other phaseouts?
- No → DAS
- Yes → Uncertain (you have to run the numbers)
Twenty-fourth, I ran across this handy rollover chart.
Twenty-fifth, virtually every consultant to advisors seems to recommend “segmenting your book” into A, B, and C clients (or Platinum, Gold, and Silver, or something similar). That approach has always bothered us. We’d rather not have a particular client than have them but give advice or service that is below our usual standards. Anyway, I just read the 1957 paper by Ernest Greenwood, Attributes of a Profession (h/t Ron Rhoades for bringing it to my attention). On page 50 it says: “The nonprofessional can dilute the quality of his commodity or service to fit the size of the client’s fee; not so the professional.”
That strikes me as correct. If you have a business with customers, you should segment your book; if you are a professional with clients, you cannot. I recommend the entire paper if you have an interest in financial planning and wealth management becoming more professional.
Twenty-sixth, new trust rankings are out from Steve Oshins.
Twenty-seventh, an excellent post on what if you’re wrong?
There are actually two, related, issues:
- What if you are wrong? (answer: diversify your bets)
- What if things change? (answer: don’t buy investments or using strategies that have a high cost of exit)
Twenty-eighth, both AQR and DFA (whom I like) have fixed income funds now, but to me they seem to be to be driven by business considerations (“We should have fixed income funds; we’re leaving fee revenue on the table by not having that asset class.”) rather than good considerations (“We have identified systematic mispricings that can be exploited to add risk-adjusted value for our clients net of fees.”).
Interestingly, this paper from AQR folks reinforces the fact that active fixed income managers remove value (net of fees) once common factors (like credit) are accounted for.
Swedroe agrees.
It’s all about credit and term (and the embedded call option if applicable).
The DFA paper he mentions sums up:
The evidence on the performance of active bond mutual fund managers paints a bleak picture for investors. I find that the universe of bond funds is dominated by managers with negative alphas. Funds with positive alphas are rare at best, and are difficult, if not impossible, to identify in advance.
I continue to fail to understand AQR’s position. From Larry’s summary of their paper:
- Value: the tendency for relatively cheap assets to outperform relatively expensive assets.
- Momentum: the tendency for an asset’s recent performance to continue in the near future.
- Carry: the tendency for higher-yielding assets to outperform lower-yielding assets.
- Defensive (quality): the tendency of safer, lower-risk assets to deliver higher risk-adjusted returns than their low-quality, higher-risk counterparts.
Let me take those in order:
If my prior is that the bond market is efficient (my default on all investments), then:
- Their “value” is nothing but a credit measure (“Thus, for value portfolios we need a credible measure of ‘fundamental’ value to compare against market prices. We measure market ‘prices’ as yields in the case of government bonds, and credit spreads in the case of corporate bonds. For government bonds we use ‘real yield’ as our measure of value.”)
- I’ll grant that momentum may well exist (it does most everywhere) and I have no reason to think it doesn’t in fixed income.
- For gov’t bonds they are calling a term measure carry, “For government bonds we use the term spread, which is the simple difference between the bond’s nominal yield and the local short-term yield” and for corporate bonds they are calling a credit measure carry, “corporate bonds we use the bond’s option-adjusted spread (“OAS”) versus Treasuries, as estimated by Bank of America Merrill Lynch, which measures the expected return to a corporate bond assuming the spread level remains unchanged.”
- For gov’t bonds they are calling short-duration defensive, “For government bonds we use effective duration as our measure.” And for corporates it’s high credit quality too, “For corporate bonds we also favour low duration, but we also include two additional indicators based on profitability (gross profits over assets) and leverage (measured by the ratio of net debt to the sum of net debt and market equity).”
So, while I will admit that the folks at AQR are undoubtedly smarter than I am, I fail to see how their metrics improve on the traditional term, credit, (and momentum). Furthermore, they only have 20 years of data and they are determining their alphas on the same data they used to build the (not parsimonious) models. That is the cardinal sin of testing in-sample and leaves me with the Scottish verdict of “not proved” (to me anyway).
Twenty-ninth, this item will start with substance and end with marketing. Both are important, I think.
First, I was thinking about what attributes a high-quality (by which I mean they do an excellent job) financial planning/wealth management firm must have. I think there are three:
- Technical excellence (including good judgement) – more than the CFP body of knowledge (which is just entry level)
- Extremely caring – either caring about doing a good job, or caring about the clients personally, or (even better) both
- Operational excellence – ability to get things done in a timely and error-free manner
Let me explain those a little further. If any one of those items is missing, the quality is a fail. For example, suppose the question is whether a client should do a Roth conversion or not (and how much):
- An advisor/firm cares about the clients and can fill out conversion paperwork perfectly, but doesn’t know when a Roth conversion would be appropriate (technical issue) or assumes a liberal is going to win the election and double tax rates so recommends converting 100% this year even though it puts the client into a much higher tax bracket (judgement issue) – FAIL for lack of technical competence.
- An advisor/firm knows exactly what should be done and is capable of doing it perfectly, but it seems like a lot of work and the client won’t know, so blows it off – FAIL for lack of caring.
- An advisor/firm knows exactly what should be done and cares about doing it, but is so disorganized the paperwork got misplaced, and then it turns out it was filled out wrong, and they forgot they would need a signature, and then it was the next calendar year so they missed a conversion opportunity at lower rates – FAIL for lack of operational competence.
The intersection of all three areas in the Venn diagram is the sweet spot
Second, let me come to the marketing portion of this. In biology there is a concept of signaling. You can be very fit, but your genetic survival won’t be very good if no one knows you are fit. In other words, you can be a self-made multi-millionaire (economic fitness), but if everyone thinks you are broke you still might not have a boyfriend/girlfriend (and your genes don’t get propagated) unless you have some credible way of signaling your wealth. (I’m not suggesting that net worth is the only or even best definition of fitness, it’s just an easy example to use.)
A problem is that people fake fitness. For example, keeping with our economic example, they buy counterfeit name brands, ape a lifestyle they actually can’t afford (hello, fake Instagram life). So what signals fitness are things that are very easy for fit (in whatever domain) folks to do but very difficult for others to do. For example, if someone is very smart, then getting advanced degrees is easy (well, easier) than for someone who is dumb. So a graduate degree from an Ivy is a very good indicator of intelligence. An unintelligent person can’t fake that signal.
Let’s take this to the advisory realm. I’ve known advisors, as I’m sure you have as well, who talked a great game on the three items above. They could spout MPT terminology (but didn’t actually know what they were talking about), talked about how much they cared for their clients (but called them muppets behind their backs), and tried to look like they were very organized (but really weren’t).
So what credible (hard to fake) fitness signals on these three areas can we send to help clients recognize our excellence? In other words, items that are relatively easy for those with the actual skills, but difficult for others to fake:
- Technical signals:
- Quality credentials (CFP, CFA, etc.)
- Writing analysis on a blog or newsletter (original, not purchased, content)
- Speaking to professional groups (not dinner seminars of lay people)
- Caring signals:
- Frequent and meaningful conversations with clients (if you really don’t care about them this is hard to do over extended periods of time)
- Remembering details about their lives (CRM can help fake this to some extent, but going deeper than just knowing the children’s names is a credible signal)
- Sending thoughtful gifts or notes at opportune times (if you care then you both know what is going on with them and what would be meaningful to them)
- Operational signals:
- Error-free paperwork
- Fast responses to phone calls and emails
- Timely reminders to do RMDs, conversions, retirement plan contributions, etc.
- Consistent follow-ups (friendly nags) to complete estate planning, get insurance coverage, change employee benefit elections, etc.
We are blessed at our firm that while we all care about each area and have multiple competencies, we have one person who really excels in each domain. (As I’m sure you would guess, I’m technical, Anitha is caring, Kaitlyn is operational. That doesn’t mean that Kaitlyn and I don’t care, or that Anitha isn’t technically competent, etc. but we each stand out in our strengths.)
Thirtieth, I saw this article (and others like it) about responses to the SECURE act and the recommendations are atrocious. Here are six significant problems with a taxable account holding non-dividend paying stocks until death vs. a Roth:
- If you need the funds before death, you pay taxes on the taxable account not the Roth.
- The heirs get an additional ten years of tax-free growth on the Roth after death.
- You can’t rebalance the holdings (without paying taxes) in the taxable account.
- The investments are sub-optimal. Voluminous research indicates that:
- Value beats growth (on average over long periods of time, etc.) and non-dividend paying stocks are generally growth stocks, but even if that weren’t true,
- A portfolio that has all options available is always superior to one that doesn’t. I.e. a restricted opportunity set is always worse than an unrestricted one, the question is only, “how much worse?” (This is the critical issue with ESG/SRI investment mandates.)
- How do you predict the future dividend policy of a company? (Remember, you can’t rebalance.)
- Ancillary benefits such as creditor protection, not being an eligible asset on the FAFSA, etc. are not available.
Finally, my recurring reminders:
J.P. Morgan’s updated Guide to the Markets for this quarter is out and filled with great data as usual.
Morgan Housel and Larry Swedroe continue to publish valuable wisdom. Just a reminder to go to those links and read whatever catches your fancy since last quarter.
That’s it for this quarter. I hope some of the above was beneficial.
If you are receiving this email directly from me, you are on my list of Financial Professionals who have requested I share things that may be of interest. If you no longer wish to be on this list or have an associate who would like to be on the list, simply let me know.
We have clients nationwide; if you ever have an opportunity to send a potential client our way that would be greatly appreciated. We also have been hired by some of our fellow advisors as consultants to help where we can with their businesses. If you are interested in learning more about that arrangement, please let us know.
We also offer a monthly email newsletter, Financial Foundations, which is intended more for private clients and other non-financial-professionals who are interested. If you would like to be on that list as well, you may edit your preferences here.
Finally, if you have a colleague who would like to subscribe to this list, they may do so from that link as well.
Regards,
David
Disclosure
|