|
Financial Professionals Spring 2021
This is my quarterly missive intended primarily for my fellow financial professionals wherein I share items I have run across or thought about this quarter which I think might be beneficial to you. Enjoy!
We have capacity for a few more consulting clients (typically RIA firms). The annual retainer for this is generally the square-root of your AUM (with a minimum of $10,000 and maximum of $50,000). For more details or to discuss further, please e-mail or call me at 770-517-8160. – David
First, Charlie Bilello published 20 Rules for Markets and Investing (pdf version) which is excellent. Similar to my Advice to a Neophyte Advisor.
Second, here is a great graph showing the number of people at various income levels:
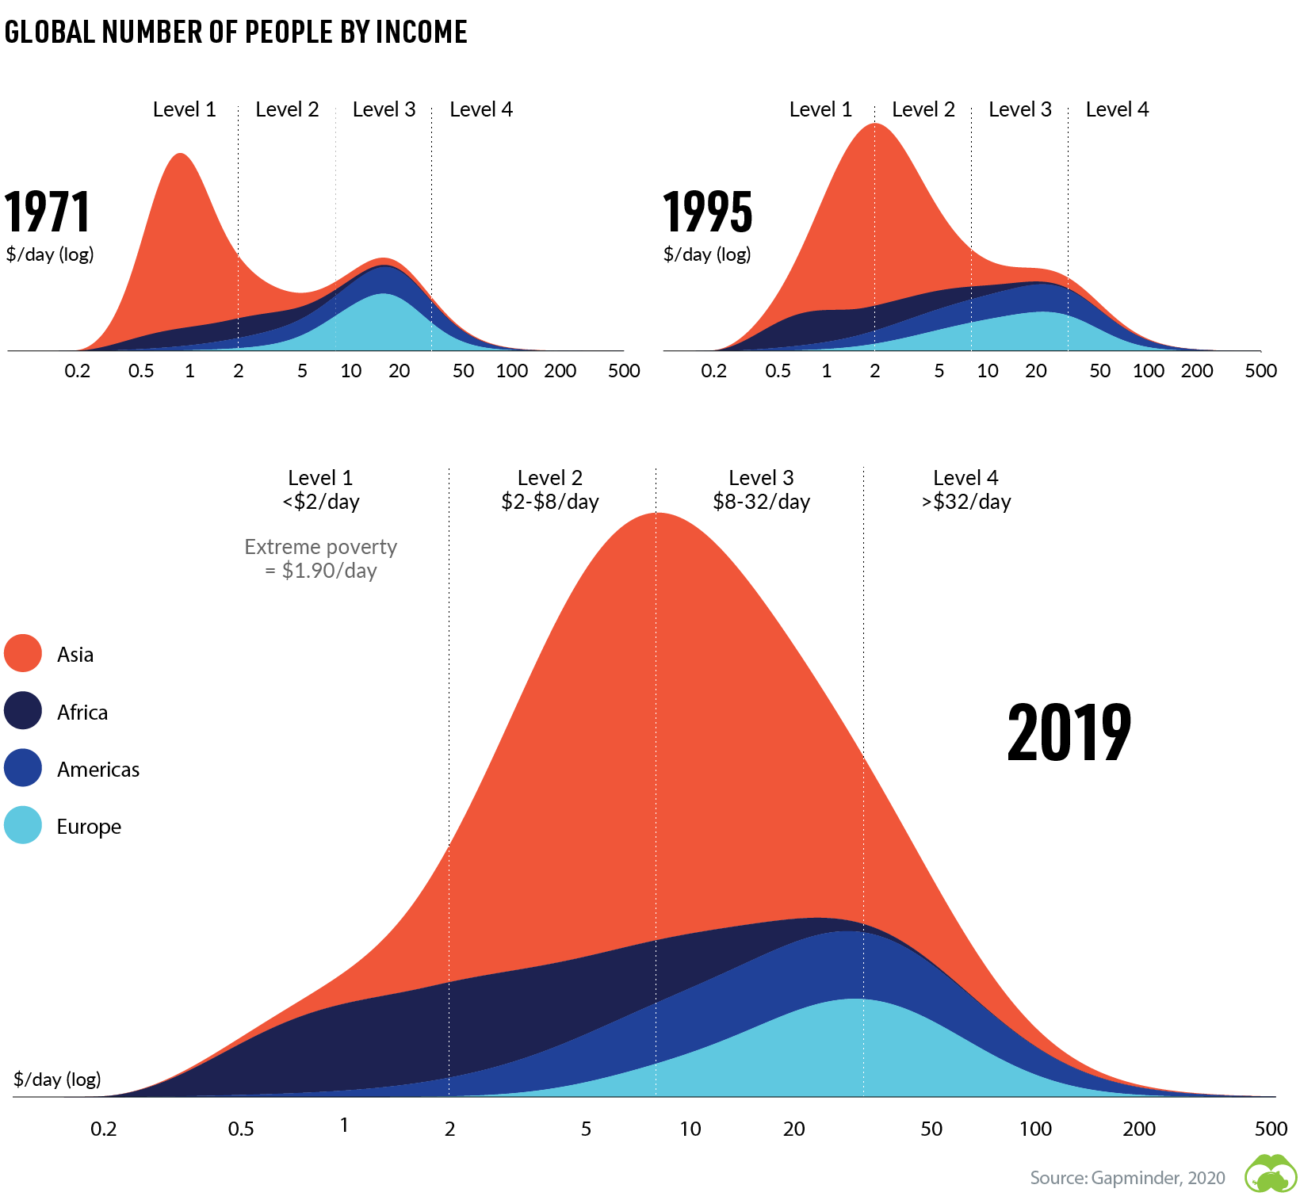
If you make more than $500 x 365 = $182,500 a year (as many reading this do) you are literally off the chart. Since we are usually surrounded by folks like ourselves we tend to have pretty skewed perspectives. (For those of us who are financially comfortable, this is a good reminder of what many face even in this country.) Notice the dramatic improvements for much of the world over time though.
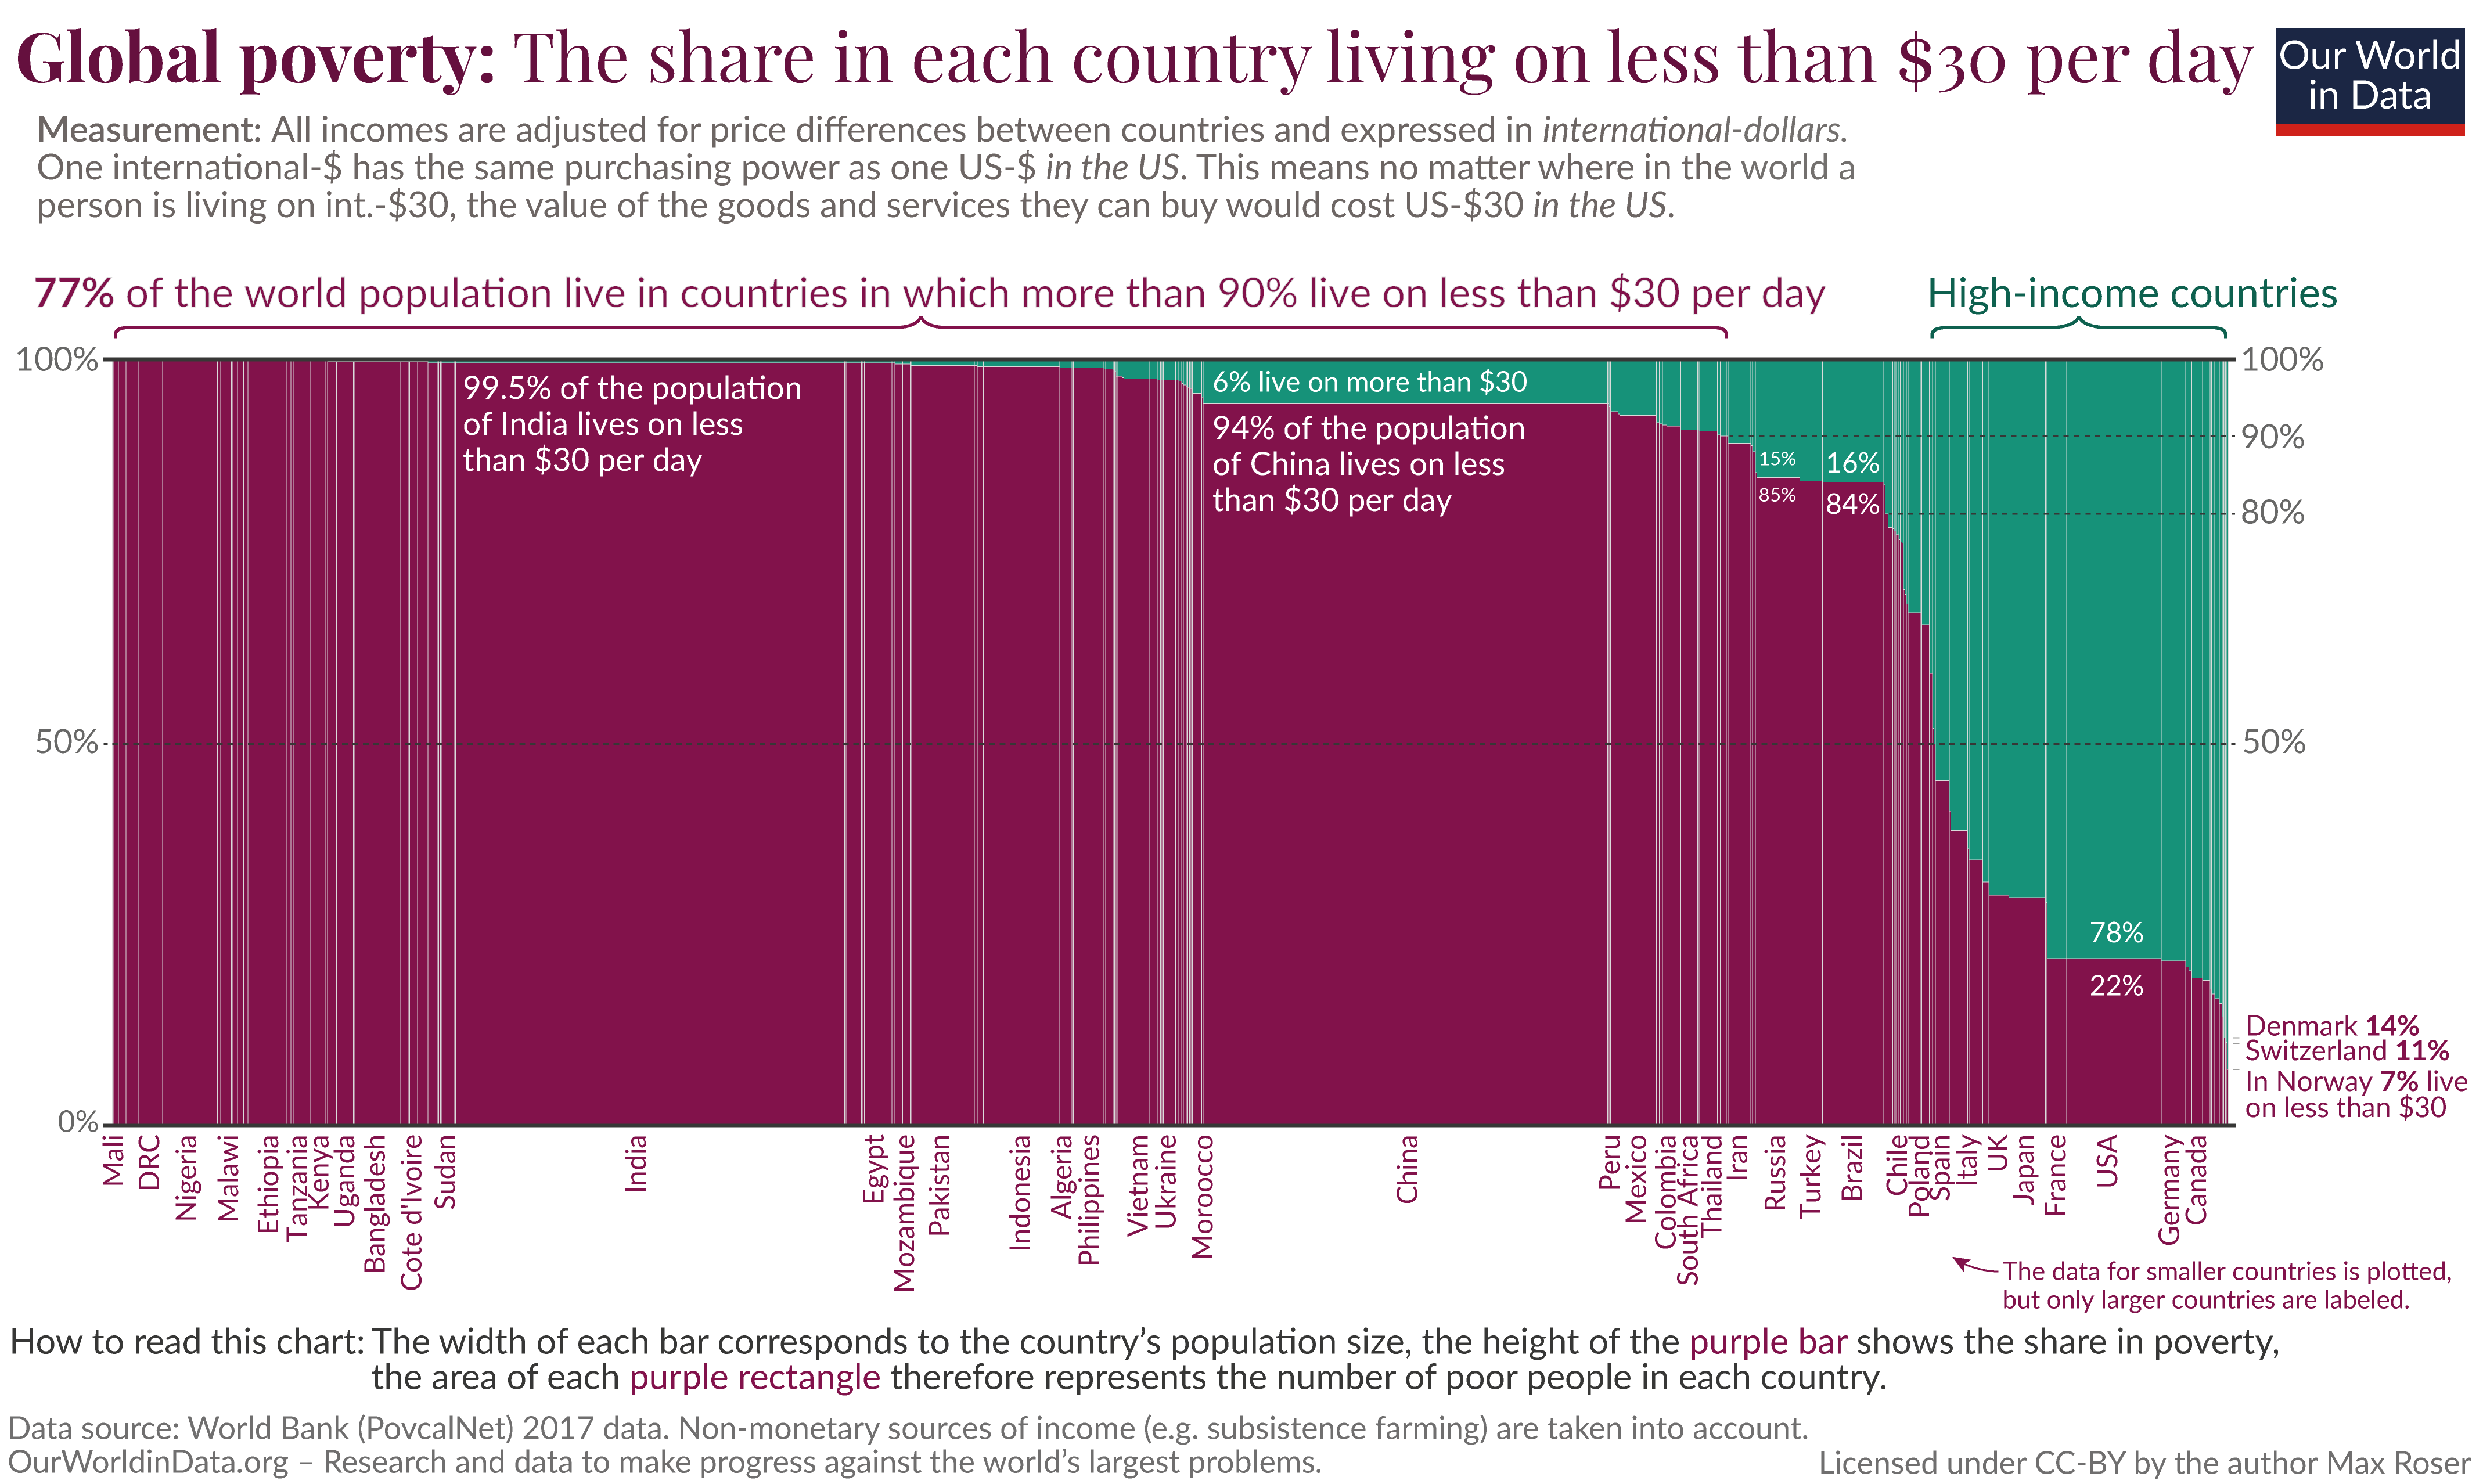
From Our World in Data: “Adjusted for the purchasing power in each country, 85% of the world population live on less than $30 per day.” That’s about $11,000/person/year. What’s surprising (to me) is that only 15% of the world is above that. Another chart from that source:
Third, we’ve had a few questions about investing in Bitcoin so I thought I’d share a few thoughts here (I previously shared this in our monthly Financial Foundations email).
There is no way to value Bitcoin (since there are no cash flows from it) so we are in the realm of uncertainty, not risk. Gambling has known odds (more or less, depending on what you are betting on) and a negative expected return (house gets a cut). Investing has estimable odds (again, more or less) with a positive expected return for bearing risk. Bitcoin has no assessable odds at all, just guesses (and hype and wishes). That’s not to say it won’t continue to skyrocket (sometimes gambles pay off), there’s just no way to know or even estimate any odds or values.
Interestingly, there is still no significant use case for it still (blockchain technology, perhaps; bitcoin, not really) which I find telling given the enthusiasm and efforts to do so. It’s like tulips (1636-1637), Beanie Babies (late 1990’s) – you are betting that someone else later will pay more for it despite the intrinsic value being roughly zero, aka the greater fool theory. There are a lot of fools out there so a buyer might make money. It’s essentially a pyramid scheme (without the cash flows) – as long as the pool of buyers increases it works. There are a lot of people who don’t own it yet, so it could go on, but there are a lot of people who don’t own most things in the world and that doesn’t automatically make them good investments.
The supply of dollars increases at about 3% per year. Bitcoin at about 1.8%. So there is a little scarcity difference, but not a material one. Cash is enormously more useful. Yet you don’t see people suggesting that squirreling away $100 bills in your sock drawer is a good way to get rich. The objection to that argument would be that there is fear that central bankers could debase the dollar. That’s fair, but the supply of Confederate dollars has been fixed for about 150 years and it isn’t skyrocketing in value despite having historical value and few people owning them. The global gold supply also increases at roughly the same rate as dollars or bitcoin (precise numbers are harder to get), and it’s useful (jewelry, electronics, dentistry, etc.), yet the expected return is the inflation rate.
Buying a little bit (very little) to avoid FOMO, indulge YOLO, or whatever is fine, but realize that it’s much closer to gambling than investing. It’s also interesting to me that we only get questions about it when it has hit a new high, never at the lows. People are mostly just buying the momentum rather than anything fundamental – because there isn’t anything fundamental. Again, there are no cash flows to value, ever.
I did a somewhat related blog post about five years ago comparing gambling, investing, and insurance. You can find that here if you are interested.
Fourth, I caught Ted Danson’s new show, “Mr. Mayor” when it premiered (it’s meh, IMO), but this exchange between the Mayor and his daughter was funny:
KENEDY: (As Orly Bremer) She said that the straw ban was exactly the kind of frivolous thing she would expect from a rich, white man’s daughter. She called us rich.
DANSON: (As Neil Bremer) No, I’m rich. You’re my plus-one…
Fifth, a post about economic inconsistencies by those of us with political opinions (i.e. most of us) is here. Also, I’m sure you saw the flood of internet memes about Bernie’s mittens (if not see here and here), and I saw an article about the liberal Bernie supporter who gave them to him. This portion caught my attention:
People have been contacting me thinking that they can get mittens, and actually they can’t. I don’t have any more, and I don’t have much of a mitten business anymore because it really wasn’t worth it. Independent crafters get really taken for a ride by the federal government. We get taxed to the nth degree, and it wasn’t really worth it pursuing that as a business, even as a side hustle. I mostly just make them as gifts.
She’s a Bernie Sanders supporter (“I’m also super pro-Bernie”) complaining about government taxes on small business!!!
Sixth, an appropriately snarky explanation of SPACs from Matt Levine.
Seventh, nothing you probably don’t know, but a good compilation of financial slam dunks here.
Eighth, good article on government debt here and another on cancelling student debt here. I think President Biden is going to try to avoid doing anything on student debt (it would have been very easy to include it in the COVID bill). “Cancel student loans” is a great slogan, but once people look at the details, it’s really a benefit for people who 1) are better off than average, and 2) made decisions to have debt vs. others who choose working through school, a less expensive school, etc.
Ninth, I’m sure you are aware of potential estate tax changes, but here’s some analysis.
Tenth, I’ve mentioned the Dunning-Kruger effect about once a year here, but it may not exist! (In the words of Maxwell Smart, “Sorry about that Chief.”)
Eleventh, which is more important, a savings rate that is twice as high, or an investment return that is twice as high? Assume $100,000 annual income (the results will have the same conclusion regardless of what you use, but I want to put some figures on it to make it meaningful):
|
Savings Rate |
Investment Return |
10 Years |
20 Years |
Baseline: |
10% |
6% |
$131,808 |
$367,856 |
Double Return: |
10% |
12% |
$175,487 |
$720,524 |
Double Savings: |
20% |
6% |
$263,616 |
$735,712 |
Difference: |
10% |
-6% |
$88,129 |
$15,187 |
When you are starting out your savings rate swamps your rate of return. It’s only after you have accumulated some capital (by saving!) that return matters much.
Twelfth, stocks for the long run? Excellent paper here. Here are some portions that call attention to facts I don’t think many folks (even advisors) appreciate nearly enough:
[W]e estimate a 12% chance that a diversified investor with a 30-year investment horizon will lose relative to inflation. The results contradict the conventional advice that stocks are safe investments over long holding periods.
For example:
At the close of 1989, Japan’s stock market was the largest in the world in terms of aggregate market capitalization. Over the subsequent 30 years from 1990 to 2019, a diversified investment in Japanese stocks produced returns (inclusive of dividends) of -9% in nominal terms and -21% in real terms. Japan’s experience is not unique, and several developed countries have realized worse performance or even complete stock market failure.
Lest you think Japan an outlier:
Evidence from the developed country sample indicates a considerable risk of loss for long-term investors. The distribution suggests that the -21% real return realization in Japan over the past 30 years is not exceedingly rare. In fact, this observation lies in the 9th percentile of the wealth distribution. Although this evidence suggests that Japanese investors were unlucky, their experience appears to be a reflection of the substantial risk exposures of long-term equity investors. An investor who learns about the distribution of 30-year returns using only the U.S. experience, in contrast, would assign a probability of just 0.5% that a return as extreme as the Japanese return realization could occur. The abundance of similar examples suggests that the U.S. distribution is overly optimistic with respect to loss probabilities.
The findings are robust:
Our findings of elevated loss probabilities for developed country markets relative to the U.S. experience are not driven by early periods, small countries, or small stock markets. In particular, loss probabilities remain elevated as we vary the starting year of the sample between 1841 and 2000, exclude countries with relatively small populations, or exclude countries with lower ratios of market capitalization to gross domestic product (GDP). Our results are also robust to alternative bootstrap assumptions and to measuring real returns in U.S. dollars (USD) rather than in local currencies. In all specifications, our analysis suggests that investors are exposed to substantial risk of loss once we account for information from the broader sample of developed countries.
Long horizons don’t fix it (data is real growth of $1):
For a ten-year investor, for example, the 1st percentile of real payoff is just $0.13, whereas the 99th percentile is $8.75. The dispersion in the payoff distribution is even more pronounced at the 30-year horizon, as the 1st and 99th percentiles are $0.14 and $53.45, respectively. This variation in investment outcomes has important implications for the consumption, savings, and asset allocation decisions of long-term investors (e.g., investors saving for retirement). The results … also appear at odds with the conventional advice that stocks are safe for younger investors based on the empirical evidence of strong mean reversion in the aggregate U.S. stock market… For the 30-year investor, the 1st percentile real payoff of $0.14 represents a catastrophic investment outcome. Moreover, even the 10th percentile result of $0.85 represents an economically large loss in real terms.
Probabilities of real losses:
[T]he likelihood of experiencing a loss is large at short horizons. The proportion of real payoffs less than $1.00 is 43.2% at one month and 36.8% at one year. This proportion continues to decrease with horizon. Nevertheless, the 20-year and 30-year probabilities of a decline in wealth from stock market investments are still substantial. The loss probability is 15.5% at 20 years and 12.1% at 30 years. These results … contradict the conventional advice that stocks are safe investments at long horizons… Even at long horizons in the world’s most developed markets, investors bear considerable risk of loss.
See the chart on page 43 for the visual representation of all of that.
Implications on the asset allocation, assuming you have access to just a developed country stock market and a real risk-free asset (such as TIPS with zero yield or volatility – just the inflation adjustment):
At the 30-year horizon, for example, the developed country investor with access to the inflation-protected risk-free asset chooses an optimal weight of 43% in stocks. [Thus 57% in the inflation-protected risk-free asset.]
And, finally, a portion of their conclusion:
Our analysis yields three primary findings. First, the long-term outcomes from diversified equity investments are highly uncertain. Based on the historical record of stock market performance in developed markets, the 5th percentile real payoff (measured in terms of local currency) from a $1.00 buy-and-hold investment over 30 years is $0.47, whereas the 95th percentile is $23.30. This evidence stands in contrast to the conventional view that mean reversion in equity returns makes equity investing relatively safe at long horizons. Second, catastrophic investment outcomes are common even with a 30-year horizon, as the 1st percentile real payoff is $0.14 and the 10th percentile is just $0.85. An investor at age 35 saving for retirement, for example, only realizes one draw from the 30-year return distribution, and we estimate a 12.1% chance that this investor will lose relative to inflation. Third, the empirical findings based on the historical record of stock market performance across dozens of developed markets are notably different from those based on the historical U.S. experience. Estimates that rely solely on U.S. data suggest that long-term real investment losses are rare.
And:
[O]ur findings indicate that investors should carefully consider the significant risk of loss before betting aggressively on equity.
My conclusion: Diversify! Diversify! Diversify! Both among stock markets and to fixed income. (Also see this.)
Thirteenth, I’ve been saying for a long time that the oft-quoted research that purported to show happiness plateaued at $75,000 of annual income was flawed because it assumed the relationship was linear. I’ve known for at least 20 years (I don’t know how long the finding has been in the literature – I didn’t discover it independently!) that the utility curve is log normal. In other words, the increase in happiness is linearly related to the log of income. Assume you start at one unit of happiness and and one unit of income. If you increase the income by one your happiness will go up by one, but to increase happiness by another one, income has to go up by two. To go up another one from that income has to go up another four, etc.
Here’s the “plain English” explanation of what’s going on. You can double the happiness of a small child by giving them a dollar because their net worth/income is so low. You could double the happiness of a middle-class person with perhaps $100,000/year. But for a major company CEO you would have to use millions. A mere $100,000 is not going to move the happiness needle.
Another example: If you won the lottery for $1,000,000 you would be happy. If you won the lottery for $2,000,000 you might be twice as happy. If you won $50,000,000 you are not fifty times as happy as if you won $1,000,000 (probably); and you certainly are not 50 times happier if you win $100,000,000 over $50,000,000.
Anyway, the authors of this find that this log-linear relationship is correct.
Fourteenth, I haven’t seen these observations discussed anywhere – but perhaps that is because they are obvious and trivial, but in case they aren’t I share them with you:
Web trading is to phone trading as app trading is to web trading. The frictions (both monetary and behavioral) are getting smaller every day but they have jumped dramatically three times in recent history: 1970’s when commissions were deregulated, 1990’s when internet trading on PCs started with even lower commissions, and finally now on apps with zero commissions.
In the mid-to-late 1990’s the advent of trading from your computer at low commission rates vastly increased retail trading and investing. Those folks (who were new to investing) bought the meme stocks of the day in the dot coms but also went all in on tech in general. The top 10 largest companies included Intel, Cisco, Microsoft, IBM, Lucent, and Oracle vs. today’s Facebook, Apple, Amazon, Microsoft, and Google. Today’s meme stocks are GME and AMC rather than pets.com and toys.com, but the gambling instinct propelling their purchase seems very similar to me. (Tesla seems to have a similar unconstrained enthusiasm, but I can’t think of a 1990’s parallel for them.)
In particular, notice that we can map some of the old companies to new companies in the same space. Will we be able to do a similar exercise 20 years from now when the FAANG stocks have been replaced by newer interests?
Broadcast.com ➔ Netflix
Geocities/MySpace/Friendster ➔ Facebook
Excite/Lycos/Altavista/Yahoo/AskJeeves ➔ Google
Kozmo/Webvan/Pets.com/Toys.com ➔ Amazon
Sears dominated retail for about a century, then Walmart usurped that “unassailable” position, but then Amazon took their spot. I guess “unassailable” really isn’t.
The tech stocks of the 1890s were bicycle manufacturers and there was a bubble. Before that it was a railroad bubble (termed a “mania” at the time), and after that it was automobiles and then airplanes. All of those had terrible returns to investors and most companies went bankrupt, but there were great returns to society (same thing with the massive fiber buildout in the 1990s). Similarly, I am enthusiastic about electric cars as a consumer, not so much as an investor. There is so much competition and the manufacturing is easier so margins should (eventually) be small. In fact, without emission credits Telsa isn’t even profitable yet. With those subsidies it has a PE of about 1,200.
I don’t think there is a necessarily an asset allocation move here except value tilts, but the parallels are interesting.
[For more on lesser-known manias, see this. These are blindingly obvious ex post but I’m sure they seemed somewhat reasonable ex ante. I’m sure a similar article, years from now, will include bitcoin and NFTs in their list of irrational manias.]
Finally, one other observation that is mostly unrelated to the above. We are accustomed to thinking of ourselves and our clients as “customers” of the custodians (e.g. Schwab). That has changed. A customer is the person who pays the business money. Citadel and other market makers who pay for order flow are the custodian’s actual customers. We (and our clients) are the product sold to those customers. It is exactly the way that the “customer” of Facebook/Google/Twitter/etc. are the advertisers, not the folks using the service. If you aren’t paying, you aren’t the customer. This is a recent change as commissions have gone to zero. I’m not sure it is a good change. There may come a day soon when a co-op custodian for RIAs makes sense.
Fifteenth, the headline, “U.S. Junk-Bond Yields Drop Below 4% for the First Time Ever” is pretty scary, but it is yield spreads we should be focused on, not the yield itself. That looks much less worrying:

Sixteenth, I keep seeing this fallacy and thought I had written up this example, but I can’t find it so perhaps I haven’t. It is sometimes called “time diversification” and it’s, as our new president might say, “malarky.”
How should an asset allocation change over time? Most folks (financial professionals included) believe that the longer your time horizon the more risk you can take. That, as stated, is clearly wrong. Let me explain by way of an example. Assume an individual is 35 years old and inherits $1,000,000. He or she will not save any additional funds and at age 65 will annuitize for retirement whatever that sum has grown to. We will ignore taxes or other complications. Now, suppose that over the next 30 years, one year will have a positive 100% return (i.e. the portfolio doubles), one year will have a negative 50% return (i.e. the portfolio halves), and the remaining 28 years will each have a return of 6%. To maximize the ending value, what sequence of those returns would be best?
I have been asking that question of financial professionals in classes for about a decade now (I don’t remember specifically when I started, but it’s been a while). Almost never do I get the correct answer. Some just have no idea and guess, but most say you want the bad return first (when the portfolio is smallest), the 28 returns of 6% next, and the best return at the end (when the portfolio is largest). I then chide them (with a smile) for failing third grade math. It’s in the third grade that I think most students learn the commutive properties of addition and multiplication. Our problem may be stated mathematically as:
($1,000,000) x (2) x (0.5) x (1.06^28) = $5,111,687
The parenthesis are just there for readability. The point is that the answer doesn’t change if you rearrange the order of the terms (the items in parenthesis)! A x B x C = C x B x A! It also doesn’t matter what the returns are – any 30 returns will give the same ending value as the same 30 returns that simply occurred in a different order.
In other words, if our investor can’t afford the risk of a 50% loss the year before retirement, he or she also cannot logically afford to take such a risk at age 35 either – it’s the same risk! In the absence of cash flows, the time horizon is utterly irrelevant to the asset allocation decision.
Nonetheless, it seems intuitively correct to change the asset allocation over time to a more conservative one. And I think that is right, but it is for a different reason than commonly assumed. Few people have a lump sum as used in the example above. They are actually converting their human capital to financial capital over time. So we don’t have two buckets (stocks and bonds) but three (stocks, bonds, and human capital). A young person’s human capital (the present value of future wages) will significantly dwarf their financial capital in the early years. Assume for simplicity that human capital was equivalent to bonds (more on this below). Further assume that to reduce risk we want half our assets to be kept safe. But we don’t have human capital in cash and can’t implement this allocation in practice. Rationally, a 35 year old should borrow against future earnings to reallocate human capital to stocks. There are significant constraints to doing so however. What we can do is “borrow” by reducing the bond position much lower than we would if there were no human capital in play. Selling bonds is equivalent to borrowing. We can take the proceeds and invest in stocks to improve our allocation. So, because of borrowing constraints our hypothetical investor should perhaps be 100% stocks in their financial portfolio at young ages and this is not risky because of the enormous allocation to human capital that still exists. (Of course it’s still prudent in most cases to have an emergency fund – or perhaps a HELOC, a wealthy parent, or something similar.)
This assumes that human capital is bond-like. It probably depends on the career, but research indicates that human capital is generally more bond-like than stock-like. Traditional stock brokers and big-ticket luxury goods workers are correlated in their wages with stocks somewhat (but perhaps not ultra-luxury goods which may be uncorrelated or small dollar luxuries which may be negatively correlated), securities attorneys (who litigate) are negatively correlated with a lag (and I think high-quality advisors are too) but most folks are relatively uncorrelated in the short run (though in extreme cases such as the great depression equity markets and human capital may suddenly become highly correlated). In the long run if the economy grows 4% per year both pay and stocks will do much better than if the economy grows 2% per year. In addition, things like Social Security are more sustainable if the economy has been growing at a faster rate. So there may be very valid reasons not to lever up to extreme levels to buy stocks even when young, but overweighting stocks seems very prudent.
In short, time horizon doesn’t matter to your asset allocation, but your human capital certainly does.
Seventeenth, Robinhood factoid (from Congressional testimony by the CEO): “The median customer account size is about $240…” So, just tautologically, half the folks have accounts smaller than that!
I know I’m late to this because I only put this out quarterly, but Robinhood’s tagline should be something like: FOMO! YOLO!! FTW!!! STONKS!!!! 🚀🚀🚀
New York Magazine explained the GME/AMC craziness this way:
But I also think young, bored men are the most dangerous people in the world and a lot of young men are at home and, quite frankly, not having sex and developing relationships with others that inhibit some of their instincts to gamble. I think if people were going out more, dating more, working more, they wouldn’t need to hit the dopamine bag that is Robinhood.
Elon Musk on Twitter about the WallStreetBets subreddit: “Like 4chan found a Bloomberg terminal”
Zero Hedge had this take: “What’s going on is basically a targeted DDOS of short hedge funds by millions of retail investors. And nobody knows what to do about it.”
Eighteenth, excellent paper here. The authors examine immediate annuities, inflation indexed annuities, and deferred annuities (e.g. QLACs). The conclusions are exactly what I would have expected:
- If you have excess funds for retirement (i.e. your goal is multi-generational wealth maximization) do not buy an annuity. You lose about 20% of your premium to insurance company overhead, profit margin, etc.
- If you do not have any excess funds (i.e. your goal is to maximize spending in retirement and leave nothing on the table) buy an annuity. You will be able to spend more because the worst cases (long life) are hedged the value of the hedge is worth more than the cost of the annuity.
Nineteenth, Apparently people who become wealthy through hard work and prudent investing have always been despised. At least today we’re just faced with opprobrium and threatened with confiscatory taxation – not death.
Twentieth, here are Lessons from Charlie Munger from his recent Daily Journal annual meeting (he’s been chairman since 1977 and presumably owns a large-ish chunk of it).
The Daily Journal annual meeting is like the Berkshire Q&A but with just Charlie. I should buy some shares and go while Charlie’s still here – it’s in LA (normally, but was virtual this year), but it also looks like you can just go.
Warren gets most of the press, but I’m a bigger stan of Charlie.
Twenty-first,“The solution to 90% of financial problems is ‘save more money and be more patient.’” – Morgan Housel (source)
Twenty-second, ex ante, investors believe they will cut their investment losses quickly while letting their winners run, but ex post making that decision they proceed to do the opposite: Dynamic Inconsistency in Risky Choice: Evidence from the Lab and Field
Twenty-third, a new Credit Suisse Global Investment Returns Yearbook out (summary version here), a new letter from Uncle Warren came out, as did J.P. Morgan’s Guide to Retirement.
Twenty-fourth, don’t trust nursing home star ratings. Maybe this ranking is better?
Twenty-fifth, no surprise, but online learning is apparently worse. The abstract:
We draw on administrative data from the country of Colombia to assess differences in student learning in online and traditional on-campus college programs. The Colombian context is uniquely suited to study this topic, as students take a compulsory exit examination at the end of their studies. We can therefore directly compare performance on the exit exam for students in online and on-campus programs both across and within institutions, degrees, and majors. Using inverse probability weighting methods based on a rich set of background characteristics coupled with institution-degree-major fixed effects, our results suggest that bachelor’s degree students in online programs perform worse on nearly all test score measures (including math, reading, writing, and English) relative to their counterparts in on-campus programs. Results for shorter technical certificates are more mixed. While online students perform significantly worse than on-campus students on exit exams in private institutions, they perform better in SENA—the main public vocational institution in the country.
I don’t know if the entrance criteria were the same. In other words, maybe the difference is in the students admitted to each program rather than the program itself. I would think they accounted for that though.
On a related topic, I have long suspected that the U.S. does better on teaching critical thinking in college that other countries. The first time this difference in approach really hit me was many years ago when I read Surely You’re Joking, Mr. Feynman! (Adventures of a Curious Character). Feynman is on my personal “most admired” list and he talked about his experience teaching college in Brazil (this is a long excerpt, but it’s definitely worth the read).
Twenty-sixth, ESG investing is mostly just marketing.
Twenty-seventh, great factor research paper here, and summary of that paper here.
Twenty-eighth, health in the U.S. is getting worse. Abstract of this paper:
Morbidity and mortality have been increasing among middle-aged and young-old Americans since the turn of the century. We investigate whether these unfavorable trends extend to younger cohorts and their underlying physiological, psychological, and behavioral mechanisms. Applying generalized linear mixed effects models to 62,833 adults from the National Health and Nutrition Examination Surveys (1988-2016) and 625,221 adults from the National Health Interview Surveys (1997-2018), we find that for all gender and racial groups, physiological dysregulation has increased continuously from Baby Boomers through late-Gen X and Gen Y. The magnitude of the increase is higher for White men than other groups, while Black men have a steepest increase in low urinary albumin (a marker of chronic inflammation). In addition, Whites undergo distinctive increases in anxiety, depression, and heavy drinking, and have a higher level than Blacks and Hispanics of smoking and drug use in recent cohorts. Smoking is not responsible for the increasing physiological dysregulation across cohorts. The obesity epidemic contributes to the increase in metabolic syndrome, but not in low urinary albumin. The worsening physiological and mental health profiles among younger generations imply a challenging morbidity and mortality prospect for the United States, one that may be particularly inauspicious for Whites.
Finally, my recurring reminders:
J.P. Morgan’s updated Guide to the Markets for this quarter is out and filled with great data as usual.
Morgan Housel and Larry Swedroe continue to publish valuable wisdom. Just a reminder to go to those links and read whatever catches your fancy since last quarter.
That’s it for this quarter. I hope some of the above was beneficial.
If you are receiving this email directly from me, you are on my list of Financial Professionals who have requested I share things that may be of interest. If you no longer wish to be on this list or have an associate who would like to be on the list, simply let me know.
We have clients nationwide; if you ever have an opportunity to send a potential client our way that would be greatly appreciated. We also have been hired by some of our fellow advisors as consultants to help where we can with their businesses. If you are interested in learning more about that arrangement, please let us know.
We also offer a monthly email newsletter, Financial Foundations, which is intended more for private clients and other non-financial-professionals who are interested. If you would like to be on that list as well, you may edit your preferences here.
Finally, if you have a colleague who would like to subscribe to this list, they may do so from that link as well.
Regards,
David
Disclosure
|