|
Financial Professionals Summer 2020
This is my quarterly missive intended primarily for my fellow financial professionals wherein I share items I have run across or thought about this quarter which I think might be beneficial to you. Enjoy!
We have capacity for a few more consulting clients (typically RIA firms). The annual retainer for this is generally the square-root of your AUM (with a minimum of $10,000 and maximum of $50,000). For more details or to discuss further, please e-mail or call me at 770-517-8160. – David
First, each quarter I provide a link at the end to the latest J.P. Morgan Guide to the Markets. I love the GTM, but two things really bug me every quarter when I read it:
First, it quotes the Dalbar data when it is well-known to have a completely wrong methodology. I like the conclusion of the Dalbar study too (individual investors mis-time the market and underperform), but just because we like the answer doesn’t mean we should use bogus data. Firms that do use the figures from Dalbar want to make a point even if they must knowingly mislead to do so.
Second, there are many graphs that look more extreme than they should because the origin is omitted on the y-axis. I am always trying to mentally correct for where the bottom (and sometimes top) of the graph really should be. To give just one example (and there are many), the “Top 10% share of pre-tax national income” on page 23 looks pretty extreme but would be much less so if the graph properly went from 0-100% instead of 30-55%. Omitting the origin is one of the topics in How to Lie with Statistics (1958).
Let me give a little more detail about the Dalbar data since it’s use is so prevalent. Suppose an investor puts away $1,000/month for 20 years (for a total of $240,000 invested) in their 401(k) and every single month earns 1%. It is obvious that the investor earned 12% a year (12.68% compounded). Dalbar would compute that the investor ended up with $989,255 (in Excel: =FV(0.01,12*20,-1000,0)). If our “stupid” investor would just have invested the entire $240,000 at the beginning instead of over 20 years they would have had $2,614,213 (in Excel: =FV(0.01,12*20,0,-240000)). Dalbar would compute that the investor earned 7.34% [($989,255/$240,000)^(1/20)-1] over 20 years instead of the 12.68% [($2,614,213/$240,000)^(1/20)-1] they should have if they weren’t dumb – a supposed “performance gap” of over 5% per year.
Obviously, the investor didn’t have the money at the beginning! This is the stupidest math and it gets repeated ad nauseum and is irritating. On average the economy grows, people get wealthier and we invest more. We didn’t have the option to invest all our future earnings 20 years ago!
Maybe people do mis-time their investments, but Dalbar uses such a ridiculous methodology that it doesn’t tell you anything at all.
Second, following is Keynes on life before 1914. Replace telephone with computer or smartphone and it could be today. Of course, what they deemed “early delivery” or “without exertion or even trouble” probably would look positively slow and onerous to us, but that just means that in the future our “conveniences” might look like difficulties! I think we definitely share the attitude of the portion I bolded.
Here is the full quote (from The Economic Consequences of the Peace, 1920):
What an extraordinary episode in the economic progress of man that age was which came to an end in August, 1914! The greater part of the population, it is true, worked hard and lived at a low standard of comfort, yet were, to all appearances, reasonably contented with this lot. But escape was possible, for any man of capacity or character at all exceeding the average, into the middle and upper classes, for whom life offered, at a low cost and with the least trouble, conveniences, comforts, and amenities beyond the compass of the richest and most powerful monarchs of other ages. The inhabitant of London could order by telephone, sipping his morning tea in bed, the various products of the whole earth, in such quantity as he might see fit, and reasonably expect their early delivery upon his doorstep; he could at the same moment and by the same means adventure his wealth in the natural resources and new enterprises of any quarter of the world, and share, without exertion or even trouble, in their prospective fruits and advantages; or he could decide to couple the security of his fortunes with the good faith of the townspeople of any substantial municipality in any continent that fancy or information might recommend. He could secure forthwith, if he wished it, cheap and comfortable means of transit to any country or climate without passport or other formality, could despatch his servant to the neighboring office of a bank for such supply of the precious metals as might seem convenient, and could then proceed abroad to foreign quarters, without knowledge of their religion, language, or customs, bearing coined wealth upon his person, and would consider himself greatly aggrieved and much surprised at the least interference. But, most important of all, he regarded this state of affairs as normal, certain, and permanent, except in the direction of further improvement, and any deviation from it as aberrant, scandalous, and avoidable. The projects and politics of militarism and imperialism, of racial and cultural rivalries, of monopolies, restrictions, and exclusion, which were to play the serpent to this paradise, were little more than the amusements of his daily newspaper, and appeared to exercise almost no influence at all on the ordinary course of social and economic life, the internationalization of which was nearly complete in practice.
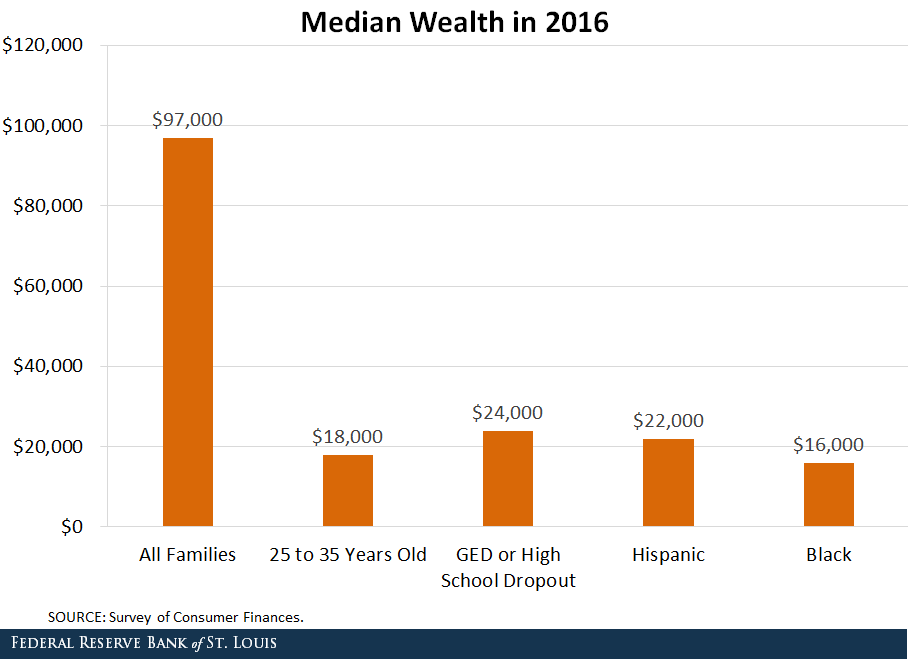
Third, we are blessed. The net worth of most folks receiving this message is probably an order of magnitude higher (at least) than the “all families”. Easy to forget when all of our clients, neighbors, and co-workers are the same as us:
Fourth, I have updated all the spreadsheets we have on the web that have annual data. As I was updating the “trend” one (and adding a few bells and whistles) I thought some observations might be useful. (The updated spreadsheet is here.)
First, when you look at historical return data, returns are dependent on your start and end dates. Using a best fit line on a log chart I think is the best way to see the real pattern. The best-fit line gives equal weight to the returns “in the middle” too, not just the start and end. The Stock (CRSP 1-10), Bond (5 Year Treasurys), and CPI figures, when computed from 12/31/1925 to 12/31/2019 are a little different from the best fit (all figures are geometric annualized numbers):
- Stock: 9.95% point-to-point but 10.78% best-fit
- Bond: 4.32% point-to-point but 5.57% best-fit
- CPI: 2.87% point-to-point but 3.73% best-fit
- Real Stock: 6.88% point-to-point and 6.80% best-fit
- Real Bond: 2.17% point-to-point and 1.77% best-fit
The only input cell for you to change on the whole spreadsheet is the yellow cell on B1 of the first tab, then you can look at the charts on the other tabs or the data starting on row 1131 of the first tab.
Here are other updates, mostly to add 2019 returns, but some minor tweaks here and there too.
PDFs:
Spreadsheets:
Fifth, on debt-to-GDP, there are scary charts and less scary charts and with all the “stimulus” going on I have been thinking about it.
I’m not an expert, but…
The “public” debt includes the Social Security trust fund and the Fed holdings. I think a proper measure should exclude those items. Here’s why:
First, the SS trust fund. The government taxes folks (income taxes, SS taxes, corporate taxes, etc.) and spends the money. In a certain sense, I think, the trust fund is just irrelevant. Imagine that the SS taxes had been lower historically so that the trust fund was always at a zero balance. Other taxes were higher by the same amount so that they could spend the money. Mathematically that is identical to what we did, but looked at that way you wouldn’t think we had “debt.” An obligation to fund SS – and everything else – as we go certainly, but we wouldn’t think of it as a debt obligation any more than we consider future defense expenditures current debt. Some accounts of “public debt” appear to count this as owned by the actual public.
Second, Federal Reserve holdings. As the economy expands, we need more money. As an oversimplification, if everyone just carries around some amount of money in their wallets as the population and the economy grows that amount would be larger. This is actually true internationally too – so many people want to hold dollars, and by that, I mean actual greenbacks, that the growth of the global economy needs more physical currency over time. (The most common denomination, globally, is the $100 bill, not the $20.) How does more money get created? The Fed buys Treasurys. When those Treasurys mature it buys more Treasurys. It uses the interest to fund its operations and donates the rest back to the Treasury. Unless the economy dramatically shrinks, most of the Fed holdings are permanent and isn’t a “debt” that ever has to be repaid. Think about it, everyone in the world tries to cash in their dollars somehow? how? for what? You walk up to the Federal Reserve window and give them all the bills in your wallet and say, “I want to cash these in.” What? What are they giving you in return? In gold standard days, sure, but not now.
So, I think the best measure is debt held by the public excluding the Fed. It turns out not only is there a chart, but after I wrote this all up I found that the folks at the Fed had already come to exactly my same conclusion and written in up almost the exact same way. I wish I had found this first.
Sixth, there is a good summary of the happiness literature here. Highly recommended short read.
Seventh, I think I have touched on this before, but not at length and some of the things going on in the world now are good illustrations of the point so I think it will resonate more right now.
I want to explain the difference between being a specialist vs. a generalist or, what is the frequently the same thing, optimizing vs. hedging.
If the world (or your corner of it) doesn’t change, you are more successful by specializing. But if it does change, the generalist does better. Similarly, in normal times, an all-stock portfolio has a higher expected return than one that includes bonds. But the portfolio with some bonds is more resilient (in a depression for example).
Here are some instantiations of these contrasting approaches:
- Buying vs. renting
- Fixed costs (e.g. automation) vs. variable costs (e.g. people)
- One product/service/skill vs. many
- One supplier vs. redundant supply chains
- Necessary personal relationships vs. expansive relationships
- All family work in the business vs. diversified incomes
- Honing your narrow skills vs. broadening them
All of this is very clear to me, but I’m not sure I can communicate it adequately. In a steady state (no catastrophes) the first “wins.” I’m going to use a depression as the trigger in the examples, but it could be anything: pandemic, natural disaster, technology changes, societal changes, political upheaval, etc.:
- You buy your home vs renting. Makes it hard to downsize easily (or quickly, or at all) in a depression, but it is cheaper (you keep the landlord’s profit margin) if there isn’t a depression.
- You buy a widget-maker that costs $500,000 and can produce 10,000,000 widgets (over its life) at $0.50 each vs. hiring people to produce them more manually at a cost of $0.60 each. But the depression causes sales to plummet and now you have an expensive widget-maker that is barely running (and that no one will buy in a depression). (Ignoring TVM, the breakeven for the widget-maker is $500,000/(0.7-0.6)=5,000,000 widgets and you would have made an extra $500,000 if times had stayed good.)
- You have been making only advanced widgets because they were the most profitable, but the market for those widgets is mostly gone and you have no other real lines of business or skill sets.
- You sourced all your raw materials from the very cheapest supplier (because you got a volume discount to concentrate your purchases), but that supplier went out of business in the depression and it will take a while to get an alternative source lined up. So now your widget-making machine is completely idle.
- You maintain great relationships with the people you need right now to work for you, buy from you, or supply to you. Why maintain relationships with your old college friends? Because if your business goes away, you may need contacts in other areas. (This is a minor reason that I do this quarterly email – I have thousands of people in lots of different types of firms and geographic areas who “know” me. This would be helpful if something catastrophic happened and I needed a job. It’s also why I don’t focus on monetizing it. It’s worth more to me to have you sort of feel like you owe me from getting free info for years. It’s not a strong feeling of indebtedness, but I don’t think the monetization would make very much money either.)
- Your (competent) spouse and children work in the business, which, because of high trust, leads to increased efficiencies (you have lower monitoring costs and higher efficiencies if you can really trust your business colleagues) but the business fails in the depression and no one in the family has an income.
- You chose to get a PhD in the field of widgets rather than a generalist MBA.
In general (there are exceptions), the less you have to lose (younger, poorer, etc.) the more you should specialize or do the first of the options listed. But as you experience success you have more to lose and should increasingly diversify or do the second (although renting seems to go the other way in practice for happiness reasons). As an extreme example, if you have the resources (a billionaire for example) you should maintain homes and holdings on multiple continents – just as a hedge against catastrophe in one country. At very high wealth levels it’s not extravagance, it’s merely prudence.
This isn’t all or nothing, in most cases you should be somewhere in the middle – you need to balance your risks. If you buy the house, probably don’t buy the widget-maker, and definitely don’t borrow to do both if you don’t have the cash!
So here’s the safe approach: use cheap debt to have cash on hand (i.e. instead of cash, not because you don’t have the cash), have diversified income streams (really diversified, and it can be tricky, the FIRE folks thought they were diversified because they had both stocks and Airbnb rentals but were gobsmacked in March), keep low fixed costs in business (and personally too – have low “needs” but liberally enjoy “wants” in good times), spouse and children with safer and/or very different jobs from you. All of those things will lead to lower net worth in good times (and on average), but higher net worth in bad times. In other words, the standard deviation of net worth is lower but so is the mean (just like bonds vs. stocks). In other words, your life (not just your portfolio) should get more bond-like and less stock-like as your net worth increases because the downside is more painful than the upside is pleasurable (see prospect theory).
Eighth, I increasingly believe that Wade Pfau is just shilling for the insurance industry. You may have seen this: “The 4% rule of thumb for income withdrawal in retirement has shriveled to only 2.4% for investors taking ‘a moderate amount of risk,’ according to Pfau’s latest calculations.”
That is the dumbest analysis I have seen in a long time. The traditional 4% rule is calculated using a 30-year time horizon and real withdrawals. Let’s assume that you earned zero real return. At that low a rate you would have little risk either so we can ignore sequence of returns risk. The problem then simplifies into 1/30 each year which is 3.33% withdrawal rate. TIPs are at very slightly negative yields right now, but close to zero. So, you could build an all-TIPS ladder and do a 3.33%-ish withdrawal rate with no equity risk whatever.
In addition to that silliness (which he uses to encourage annuity purchases), he also says: “Someone with whole life insurance can borrow against its cash value to cover spending on a temporary basis so they don’t have to sell their portfolio of assets at a loss. It’s a loan that can help bridge the gap in spending so they’re not having to take that [money] from their portfolio.” Aside from the massive illiquidity, opacity, and the high cost structure of insurance, his recommendation implies that market timing works – how else would you know when the right time would be to sell assets to live on?
Ninth, interesting paper here. In summary, a firm has “better” (higher risk-adjusted return) investment products when it has these personnel (in order, with the best at the top):
- PhD (in any field) who has published in one of the top journals in that field.
- PhD in finance or economics or closely related field (not published in a leading journal)
- PhD in something other than finance or economics or closely related field (not published in a leading journal)
There is a similar paper here that looked at personality types/traits.
Tenth, in a recent NYT magazine article, Madeline Albright said, “I’m an optimist who worries a lot.”
I think that’s a good phrase and a good position for a financial planner or investment manager (or business owner). We should be optimists because, in general, economies grow and life gets better (see Triumph of the Optimists). But we should not ignore risks in the short run. The concept of “permanent impairment of capital” is relevant here. While you should expect success, you should avoid risks that, if they occurred, you could not recover from (hence the “permanent”). So, it’s ok to be predominantly exposed to stocks, but not exclusively, and only in a diversified manner. Also, buy appropriate amounts of life insurance, disability insurance, umbrella insurance, etc. Have an adequate emergency fund. Save more than might seem to be strictly necessary.
Another key phrase in financial planning is, “but what if it doesn’t” and variations.
Some examples you may have heard from clients or said yourself:
- Stocks have earned 10% a year historically. (But what if they don’t?)
- I plan to work until 70. (But what if you can’t?)
- My job is safe. (But what if it really isn’t?)
- Etc.
Bottom line: “Expect the best, plan for the worst, and prepare to be surprised.” – Dennis Waitley
Eleventh, Trusts & Estates had a few worthy articles recently, though I think most of you will not be able to access it because of the paywall. Thought I would pass them along anyway:
This article explains that if a client makes a deductible IRA contribution after age 72 (which is now permitted due to the SECURE act if the client has earned income, is under the AGI limit or isn’t an active participant in a qualified plan, etc.) any QCDs for life are included in income up to the amount of the deduction. For example, a 73-year-old client has some earned income and contributes $7,000 to their IRA (deductible). The first $7,000 of QCDs are not tax free distributions though they may be claimed as itemized deductions.
This one and this one explain how to use CRTs to get a stretch back even though the SECURE act created a 10-year withdrawal period (for most people).
Twelfth, I have been a little concerned that the market has come back so fast that perhaps it is overvalued relative to future earnings. In other words, you have a P/E pre-crisis that was perhaps a little elevated, and prices have clearly declined, but has the E declined more or less (as a percentage). I.e. are markets cheaper now or more expensive? Or, what is the same thing but said a different way, is the discount rate (i.e. the expected return) now higher or lower than it was? Since bond prices have declined, you might expect the discount rate on stocks has declined similarly (so the ERP is constant). Conversely, since there is more risk now, you might expect the discount rate to have increased to reflect that higher risk (higher ERP). According to this paper, the discount rate on stocks has increased – if analyst forecasts are unbiased. (Note that unbiased is not the same as accurate. You can be inaccurate – your estimate ends up being wildly off – but unbiased – you are just as likely to be wildly high as wildly low.)
Analysts have been shown to be biased toward too little change on incremental news (so you get momentum as they adjust again later) and biased toward excessive change on big/impactful/salient news (e.g. war breaks out) so you get reversals in the long run. This seems like a situation where there would be more overreaction than underreaction.
Thus, it appears the ERP is higher than it was before. This is a good thing for investors going forward – if they haven’t bailed out!
Note: I originally wrote the above back on the second of May and the market is up significantly since then so YMMV.
Thirteenth, as the market and, to a lesser extent, the economy seem to be doing ok at the moment, these are probably low probability, but I thought I would share what’s being mentioned in Washington: More RMD relief (also here) and increased DC plan limits.
But Joe Biden (perhaps not surprisingly) is going the other way: “I’m going to get rid of the bulk of Trump’s $2 trillion tax cut, and a lot of you may not like that but I’m going to close loopholes like capital gains and stepped up basis.” (emphasis mine)
Fourteenth, is value investing dead? This argues “no” and Cliff Asness comments on it as well here. Good argument the other way here though.
Rob Arnott and Cliff Asness are leading authorities on factor construction, valuation, etc. They also famously disagree and argue with each other all the time – it’s actually entertaining (see https://www.google.com/search?q=asness+vs.+arnott). So this is particularly surprising (from Cliff’s paper above, and this one from Rob Arnott):
Arnott: “[V]alue is unusually cheap relative to growth. The valuation [is] the 100th (bottom) percentile of the historical distribution as of March 2020.”
Asness: “[Value] is now (March 31, 2020) at the 100th percentile vs. the 50+ years of history we have.”
This article, by Larry Swedroe, is ostensibly about value factor investing too, but is really about investment discipline.
Fifteenth, another excellent piece from Morgan Housel: When You Have No Idea What Happens Next.
His main point is, “Read more history and fewer forecasts.” Forecasts generally extrapolate what is currently happening into the future. And, usually, that is the best guess. But history shows that there are surprises and we underestimate their frequency. I would tweak his recommendation though. If you read history books (books written at some later point about an earlier point) the author will, consciously or not, foreshadow. The story will be a nice narrative with effect following cause. But as events are happening it is not that clear – not even close.. Non-linearities abound.
So, my tweak to his recommendation, is not to read history books, but to read old books. Books written at the time that don’t know what is going to happen.
Also, see this recent Now I Know post. We also don’t remember what we thought the market or economy was going to do. But we look back and think we remember knowing things that we actually did not know – or at the very least didn’t know strongly (tech stocks in 1999, real estate in 2008). We will look back on 2020 and if the market does well or poorly for the year as a whole, we will remember knowing in early Spring how it was going to play out.
Morgan also had an excellent piece in December on The Psychology of Prediction. His first item resonates with me because that’s where I am on value tilts in the portfolios:
1. The distinction between “wrong” vs. “early” has less to do with analytics than the social ability to prevent listeners from giving up on you.
Say it’s 2003 and you predict the economy is going to collapse under the weight of a housing bubble.
In hindsight, you got that right.
But it’s 2003. So those who listened to your predictions have to wait four years for that prediction to come true. And I guarantee you, most would not have. They would have given up and walked away long before housing tanked. Those who did stick with your prediction have to account for the opportunity cost of being four years early – both the financial cost and the social cost of looking wrong. The two can easily swamp the eventual benefit of being right.
Chronicling the 1990s bull market that never seemed to end, Maggie Mahar writes in her book Bull!:
The fact that the bull market lasted so long presented problems even for the most skeptical reporters. “You can only say that price/earnings ratios are too high so many times,” reflected a business writer at The New York Times. “Eventually, you lose credibility.”
Weil agreed: “There was widespread thinking among skeptical financial writers—this can’t go on—but it has. What are we supposed to do about it? How many times can you say it? The problem is, if you’re a daily newspaper, you have to come up with something different to say every day.” Moreover, “in a public marketplace, if you write a story that doesn’t resonate with the marketplace—you have to question the story,” said The Wall Street Journal’s Kansas. “Reporters can get hesitant about their own convictions.”
Some people preemptively realize this. I remember watching CNBC in March 2009, when the S&P 500 bottomed out 60% below its previous high. Host David Faber noted that every trader he talked to knew a big market rally was coming. “So, how are you invested?” Faber asked them. “In cash,” the traders told him. Faber said it was because they couldn’t afford to have another down month. They were confident a turn was coming -- and they were right – but being even a month early was too much risk. They couldn’t stand going to their bosses or their investors and explaining why they lost money again. In Excel, the difference between wrong and early isn’t that big a deal. In Word, it’s enormous.
Those last two sentences are perfect. (Another recent article on decision-making here.)
Sixteenth, we sent the following email to all of our clients who were born in 1960, and I thought you might want to do something similar as well, or at least be aware of the issue if you weren’t already:
There was a Wall Street Journal article yesterday (“If You Were Born in 1960, You Pay Extra for Covid-19”) that highlights an issue that pertains to five of our clients. Unfortunately, one of them is you.
The article is behind a paywall so you probably can’t read it, but the issue has to do with how Social Security benefits are calculated. Basically, they use a formula that adjusts historical wages for wage inflation to compute benefits. The formula uses average wages the year in which a Social Security participant turns 60 to do the conversion. Since wages in 2020 are likely to be much lower than they would have been because of the lockdowns it will permanently lower your Social Security benefits compared to what they would have been if your age 60 had occurred in 2019 (or 2021, assuming the economy restarts).
We just wanted to let you know about the issue. There isn’t anything for you to do and Congress may well create a legislative patch. I should note that there was a similar problem years ago too but with a different cause and Congress did not correct that one. I think this is different enough that they will fix it though.
Seventeenth, here is Peter Bernstein on investment history, from Is Investing for the Long Term Theory or Just Mumbo-Jumbo?
The lesson of history is that norms are never normal forever. Paradigm shifts belie blind faith in regression to the mean… For 170 years, the highest-quality long-term bonds in the United States yielded an average of 4.2 percent within a standard deviation of only a percentage point. In 1970, yields broke through the old upper limits and started heading for 7 percent. Investors stared: how could they decide whether this was a blip or a new era? And then there was the moment in the late 1950s when the dividend yield on stocks slipped below bond yields. Again, investors back then had no handy rules to tell them whether this totally unexpected development was a fundamental shift in market structure or just a temporary aberration that would soon correct itself, with the “normal” spread of stocks yields over bond yields reestablishing itself.
John Maynard Keynes, who knew a few things about investing, probability, and economics, took a dim view of the idea that you can look through the noise to find the signal. In a famous passage, he declared that:
The long run is a misleading guide to current affairs. In the long run, we are all dead. Economists set themselves too easy, too useless a task if in the tempestuous seasons they can only tell us that when the storm is long past the ocean will be flat.
Keynes is suggesting that the tempestuous seasons are the norm. The oceans will never be flat soon enough to matter. In Keynes’ philosophy equilibrium and central values are myths, not the foundations on which we build our structures. We cannot escape the short run…
Those who believe in the permanence of tempestuous seasons will view life as a succession of short runs, where noise dominates signals and the frailty of the basic parameters makes normal too elusive a concept to worry about. These people are pessimists who see nothing in the future but clouds of uncertainty. They make decisions based only on the short distance ahead that they can see.
Those who live by regression to the mean spread their time entirely differently. They expect the storm to pass, so that one day the ocean will be flat. On that assumption, they can make the decision to ride out the storm. They are optimists who see the signals by which they will steer their ships toward that happy day when the sun shines through.
My own view of the matter is a mixture of these two approaches. Hard experience has taught me that chasing noise leads me to miss the main trend too often. At the same time, having lived through the bond yield/stock yield shift of the late 1950s and the breakthrough of bond yields into the stratosphere beyond 6 percent in the late 1960s – just to mention two such shattering events out of many – I look with suspicion at all main trends and all those means to which variables are supposed to regress. To me, the primary task in investing is to test and then retest some more the parameters that appear to govern daily events. Betting against them is dangerous when they look solid, but accepting them without question is the most dangerous step of all.
Eighteenth, Now that it seems COVID19 is not going to be as bad as it could have been market up significantly from the lows, countries and states have reopened, linear rather than exponential growth of infections and deaths) other things to plan for/worry about are here and here.
Nineteenth, mortgage rates are very low. For those with mortgages, I would highly recommend looking into refinancing. Many articles on this, but here is one.
Twentieth, I know I have written on risk tolerance before, but, to recap, risk tolerance is a terrible term because it encompasses three different factors:
- Risk capacity – how much risk the client can afford to take
- Risk propensity – how much risk the client is comfortable taking
- Risk recognition – how much risk the client thinks there is
Sometimes, all three are muddled together into “risk tolerance” but even at best the last two are usually combined. One of the long-standing issues with risk tolerance (with that nuddled definition) is that it isn’t stable – people’s tolerance changes over time. There has been speculation that it is the third item, the recognition, that is the issue. Anyway, a new paper supports that conclusion. During bull markets people don’t have higher risk propensity, they just think there isn’t any risk! During bear markets they think there is lots of risk but have a similar risk propensity.
Twenty-first, over Memorial Day weekend I read a good write-up from Bessemer Trust on the Heckerling conference. Yes, this is how I spend holiday weekends – reading 189 pages of estate tax minutia. OK, I didn’t read all of it, just most of it. (I think that still makes me a social pariah.)
I’m sure most (none?) of you will want to wade through it, but the last few pages (182 to the end) have the humorous (by the standards of estate planning and tax attorneys anyway) portions.
Twenty-second, good financial planning questions from Morningstar here.
Twenty-third, for Charlie Ellis (Winning the Loser’s Game) fans (I’m one) here’s a good interview.
Twenty-fourth, I frequently say there are three ways to beat the market:
- Know something no one else knows
- Process known information better that the collective wisdom of the market
- Exploit a structural or psychological anomaly
The first one is generally insider trading, but maybe on occasion you can learn something relevant unknown to the marketplace at large. (I had it happen once with a microcap company that I was involved with as a corporate customer.) The second one I think is pretty much impossible. On occasion someone may think something different from the market and might even be right, but I suspect that they would be wrong as often as right. In other words, it’s luck not skill and won’t lead to excess returns.
The third item is where we think there are opportunities. I have two standard examples of each:
- Structural anomalies
- Barely non-investment-grade bonds
- Low vol stocks
- Behavioral anomalies
Let me talk about the structural ones briefly. Many investors are not allowed (by law or charter) to own non-investment-grade fixed income (i.e. junk bonds). Active managers need high returns to make up higher fees so they will own deeper junk to try to make those returns. Thus BB bonds are “under-owned” and may have a higher risk-adjusted return than other bonds. Similarly, many active managers have a benchmark such as the S&P 500 and people don’t really do a risk-adjusted return comparison, they do an unadjusted comparison. So the managers, needing alpha to at least make up the fees, will buy higher beta stocks. It’s not skill it’s just another way to get leverage. They (generally) are limited to being long-only and not using explicit leverage so they can’t really own low-beta stocks even if the risk-adjusted returns are higher.
Anyway, Larry Swedroe just put out a piece on the low vol anomaly and Morningstar has a piece on the “barely non-investment-grade bonds” one.
Twenty-fifth, just an observation, perhaps we should retire the phrase, “avoid like the plague” because people don’t seem to really do that much – at least after a few months.
Twenty-sixth, I sent this out in 2017, but good summary here. Main points from that link:
- The Market is Probably More Efficient Then You Think
- The Classic Factors, Value and Momentum, Survive Scrutiny
- Cheap, High-Quality Firms Generate the Highest Expected Returns
- Portfolio Construction Matters. A Lot.
- Small stocks are preferable to larger stocks
- Equal-weight is better than market-cap weighting
- Rebalancing more is better than rebalancing less
- Don’t Believe Everything You read.
Twenty-seventh, some lessons relevant to working with clients: How to Persuade People to Change Their Behavior
Twenty-eighth, I thought this paper was excellent. Our language influences what we see and think and having the term “Veblen Entrepreneur” available is very useful. (For example, in cultures without words for certain colors, they can’t easily see that color. We have trouble thinking about concepts without appropriate terminology; this is where jargon is useful to experts.)
I think most people with business/economics backgrounds are familiar with Veblen goods. The term comes from Thorstein Veblen who wrote The Theory of the Leisure Class (1899). Veblen goods are valued for their conspicuous cost rather than for their utility (usefulness). Many luxury cars, watches, handbags, etc. are in this category. They are interesting in that the demand curve, which normally is downward sloping (the cheaper it is the more demand there is), may be upward sloping (the more expensive it is the more demand there is). Veblen coined the term “conspicuous consumption” – it isn’t a new phenomenon!
The authors of the paper are focused on businesses seeking VC money, but, further down the food chain, I think there are lots of folks who do this on a smaller scale. In my (misspent) youth, I was very active in networking activities through the Chamber of Commerce, BBB, etc. and was president of a BNI group. As far as I can tell, these groups are primarily useful to their participants by feeling like work without actually being work. They are mostly people with few (or no) prospective customers talking to each other in the hopes that one of them will perhaps stumble upon one. Thus, most (not all) of the folks participating were low-end Veblen Entrepreneurs. I think virtually every MLM participant, most real estate agents, and many purchasers of inexpensive franchises are Veblen entrepreneurs, and I love having a good term for it.
I also think that there are many Veblen investors (and I am apparently the first to coin that term!) where the fun, excitement, or social cachet are far more important than the expected returns. Here are some examples of what I believe are Veblen investments:
- Penny stocks
- VC/PE/Hedge Fund investments (for individuals, not institutions)
- Crypto currencies
- SRI/ESG/impact investments
You may have seen articles about Veblen investors joining Robinhood recently… apparently for the LOLs rather than the risk-adjusted returns. (But sometimes, it’s tragic.)
Anyway, back to Veblen Entrepreneurs. I typically give two pieces of advice to people (such as clients) who are thinking of starting a business:
- Read The E-Myth Revisited: Why Most Small Businesses Don't Work and What to Do About It
- Set a hard stop on how much you will sink into the venture
I want to elaborate on that second item. Many clients have too much money to start a business. I’m sure that sounds odd. What I mean is, to start a business you must be optimistic – you have to believe that even though most new businesses fail you will be the exception. So suppose a client has $1,000,000 portfolio and is unhappy in their job (or loses it). Rather than get another, similar, job, they decide to start a small business – let’s say a restaurant. The problem is that, because of their optimism, they can delude themselves that success is “right around the corner” until they have spent the whole $1,000,000. They need to in advance set a hard stop of some sort. If they only had $200,000 then running out of those funds would force them to close the restaurant and get a job again. With $1,000,000 there is less pressure to get profitable or to abandon the attempt until the whole $1,000,000 is gone. The appropriate metric will depend on the client and business, but it should be 1) specified in advance, 2) in writing, 3) specific, and 4) inviolable.
Anyway, new research has come out that supports my concerns. Here’s the abstract:
We examine how wealth windfalls affect self-employment decisions using data on cash payments from claims on Texas shale drilling to people throughout the United States. Individuals who receive large wealth shocks (greater than $50,000) have 51% higher self-employment rates. The increase in self-employment rates is driven by individuals who lengthen existing self- employment spells, and not by individuals who leave regular employment for self-employment. Moreover, the effect of wealth reverts for individuals whose payments run out. Rather than alleviating a financial constraint, our evidence suggests that unrestricted cash windfalls affect self-employment decisions primarily through self-employment’s non-pecuniary benefits.
Elsewhere in the paper:
[W]e find that, once individuals stop receiving shale royalty payments, they tend to exit self-employment for regular employment, consistent with the idea that shale royalty payments were subsidizing their income in a way that allowed them to be self-employed. This evidence also supports the view that the wealth shocks were not being used to fund self-sustaining or otherwise productive projects…
Twenty-ninth, if any clients took RMDs early this year, before they knew they didn’t have to, relief has been granted.
Thirtieth, it is an accepted economics principle that returns will flow to the scarce factor of production. In other words, if you have the coffee shop franchise in Grand Central Station the landlord will extract the excess rents, not the coffee shop. Similarly, capital is abundant but the ability to generate excess returns scarce. Thus, you would expect those capable of producing excess returns to charge fees brining the net excess returns to zero. These two recent papers (here and here) support that view – indeed, adjusted for risk and illiquidity, the excess returns (net) are probably negative!
Finally, my recurring reminders:
J.P. Morgan’s updated Guide to the Markets for this quarter is out and filled with great data as usual.
Morgan Housel and Larry Swedroe continue to publish valuable wisdom. Just a reminder to go to those links and read whatever catches your fancy since last quarter.
That’s it for this quarter. I hope some of the above was beneficial.
If you are receiving this email directly from me, you are on my list of Financial Professionals who have requested I share things that may be of interest. If you no longer wish to be on this list or have an associate who would like to be on the list, simply let me know.
We have clients nationwide; if you ever have an opportunity to send a potential client our way that would be greatly appreciated. We also have been hired by some of our fellow advisors as consultants to help where we can with their businesses. If you are interested in learning more about that arrangement, please let us know.
We also offer a monthly email newsletter, Financial Foundations, which is intended more for private clients and other non-financial-professionals who are interested. If you would like to be on that list as well, you may edit your preferences here.
Finally, if you have a colleague who would like to subscribe to this list, they may do so from that link as well.
Regards,
David
Disclosure
|