|
Financial Professionals Spring 2019
This is my quarterly missive intended primarily for my fellow financial professionals wherein I share items I have run across or thought about this quarter which I think might be beneficial to you. Enjoy!
First, I sent this out to clients the first week of January:
Enclosed is your portfolio statement for the fourth quarter of 2018 – at least it’s over! For many clients we have at least been able to harvest some losses which will help with future tax bills, but that is only a small consolation. We realize data does little to assuage fear when we see our portfolio values fall, but data is what keeps us from making emotional decisions that harm our financial plans in the long run. The rest of this letter will hopefully provide some helpful historical perspective.
The S&P 500 had a return last quarter of -13.52% which was the 22nd worst since 1926 (bottom 6%). A quarter in the bottom 6% means you should expect it every 4-5 years on average, so this is not unprecedented – though obviously it feels scary.
There is a tendency to believe that one period of returns somehow predicts the next – that there is a pattern of some sort. It just isn’t true. Historically, when returns were within a percentage point of what we just experienced (i.e. losses between 14.52% and 12.52%, which has happened seven times), the average return the next quarter was 9.59%. But the range was huge, from a further loss of 17.28% to a gain of 88.84%. (A more thorough, but technical, version of that same point is on the back of this page for those who are interested.)
The first week of this month, I followed up with this:
Enclosed is your portfolio statement for the first quarter of 2019. It was obviously a great quarter for investors. With the S&P 500 being down 13.52% in Q4 to up 13.65% in Q1 it probably seemed like a wild ride. Three brief points though:
- No client had performance nearly that extreme, as we always properly diversify.
- It might seem that someone who experienced those returns would be back to even, but it doesn’t work that way. If a portfolio declines 50% it has to grow 100% to return to the original value. Thus, someone who was down 13.52% and then up 13.65% would still be down 1.72%.
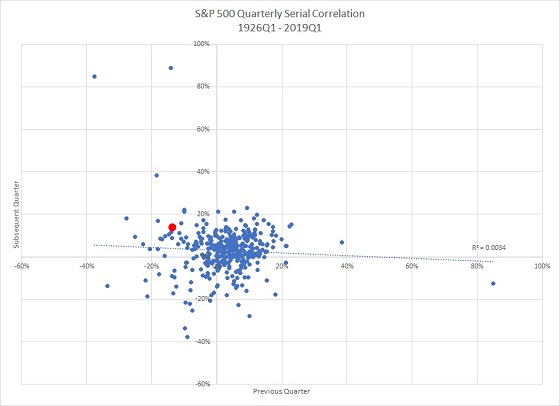
- It also might seem that two quarters like that are extreme, but they aren’t at all. On the back of this page is the same chart I included last quarter, but with the most recent data point added (plotted larger and in red).
Here is the explanation and chart I included both times (the only difference is the red dot added the second time, click for larger version):
Below is a graph of the quarterly returns of the S&P 500 (and predecessor index) since 1926 with one quarter on the x-axis and the following quarter on the y-axis. If good quarters are followed by another good quarter and bad quarters by another bad one (i.e. positive serial correlation) then the points would be in a rough grouping from bottom left to the top right. If, conversely, a good quarter was followed by a bad one and a bad one by a good one (i.e. negative serial correlation), then the points would cluster from the top left to the bottom right. As you can see, there is essentially no relationship between the returns of one quarter and the next – the “best fit” line is shown and it has an R2 of essentially zero.
Second, Ben Carlson shared 10 Things Investors Can Expect in 2019.
Third, I assume everyone getting this already know how this works, but in case not here is some life insurance failure.
Fourth, there was a query on the NAPFA message boards about how to evaluate pension vs. lump sum options. Thought you might like to see my response:
First, we do the quantitative analysis:
- Use mortality tables to get the expected future value of the payment (keeping in mind any J&S options selected). More below.
- Use bond rates to discount those flows to today. More below.
- Compare the present values of all the options (including the lump) to each other.
Then we do the qualitative analysis (not an exhaustive list, but what immediately occurs to me):
- How do they feel about the options?
- Will they blow the funds if taken in a lump?
- How strong is their legacy desire?
- How much fixed income exposure should they have overall? (a large pension, SS, and little else may be too much FI)
- Etc.
For the mortality weighting, assume opposite sex married clients, both currently age 65, both higher SES (socioeconomic status – so the life expectancy is a little longer), 50% J&S option. The monthly benefit is $2,000. Let’s find the mortality-weighted value of that payment just for the benefits received at age 85. There is a 60% chance he is alive at that age. There is a 26% chance that she is but he isn’t. So the value is ($2,000 * 0.60) + ($2,000 * 0.50 * 0.26) = $1,460. Repeat (using Excel or something similar) for all years.
For the bond rates, use nominal bonds (unless the pension has a COLA, then adjust by the TIPS vs nominal bond spread at all years). If you believe the federal government will bail out the PBGC (if necessary) use treasuries for the rates below the PBGC guaranteed levels, use the company’s corporate bond rates for the portion (if any) above the PBGC limit (this builds in default risk). If you don’t think it will be bailed out, use the corporate bond rate for everything. If you think there is a 50/50 shot (or whatever), then weight accordingly.
As an industry, I think we do a middling job on the qualitative analysis and a terrible job on the quantitative analysis. In other words, advisors have no idea of the value the client would be gaining or giving up with the various options because they don’t bother to do the math. (This is true of stock option exercise decisions as well.)
Data here for those who are interested:
Joint Life Probability Spreadsheet
Black-Scholes Option Pricing Spreadsheet (since I mentioned options too)
Fifth, a quote from one of my favorite authors:
The outcome of successful planning always looks like luck to saps.
– Dashiell Hammett
We, and our clients, probably look lucky to many fellow-citizens, but it’s foresight and preparation that is mostly responsible for financial success.
Sixth, great article here. This is why AQR, DFA, Vanguard, et al will never eliminate their active competitors – most people are far more comfortable with qualitative rather than quantitative decisions despite the probable inferiority.
Seventh, Would Greater Awareness of Social Security Survivor Benefits Affect Claiming Decisions? Basically, they conclude “no” because men are selfish (they said it more politely).
The men reading that reacted:

And the women responded:

We have seen this with some of our planning clients (most commonly choosing the life-only pension option to have a higher standard of living now to the detriment of the probable surviving widow who will be unable to maintain her standard of living), but the attached paper has empirical evidence. In short:
- Husbands do not seem to consider the prospective drop in income experienced by their widows when choosing a Social Security claiming age.
- Husbands respond instead to immediate concerns such as pension incentives and health conditions.
- A simple information intervention that highlights the likelihood and consequences of widowhood, and demonstrates how delayed claiming enhances survivor benefits, may be insufficient to change the stated claiming intentions of older husbands.
- The framing of these information interventions (e.g., presenting the full retirement age as the default) seems to affect claiming at least as much as the content presented.
Eighth, the summary reports of all the Heckerling proceedings can be found here. Supplemental materials here. Almost as good as being there!
Ninth, F. Scott Fitzgerald: “Let me tell you about the very rich. They are different from you and me.” Ernest Hemmingway: “Yes, they have more money.”
That exchange above is well-known but probably fictional. Most people have mistaken views of the rich, chief among them is probably the view that their incomes are from “clipping coupons.” In other words, the “idle rich” are the paradigmatic case. (For the youngsters out there, “clipping coupons” refers to bond coupons, not grocery coupons, from back when bonds were physical things that had “coupons” for the interest attached. You would cut them off and either mail them to the company or deposit them with your friendly banker or broker to get your interest.)
In fact, today most high-income people are individuals with large amounts of human (not financial) capital. See this paper for an excellent exposition.
[The other common misconception is that high consumption (“conspicuous consumption” in the famous 1899 wording of Thorstein Veblen) equals wealth. This is not only not true, it may be the opposite of true. See The Millionaire Next Door to be thoroughly disabused of that notion. Adding to the confusion, the more liberal of our Congress-critters mistakenly (but continually) advocate taxing “the rich” through higher income taxes despite those being two distinct, though somewhat correlated, groups (more info here). I don’t worry too much about higher rates though. Regardless of the ostensible rate, the effective rates aren’t nearly as high, even for the very high income (top 0.1% is $2,800,000 and up of income today). Here is a great chart from the Tax Foundation.]
Tenth, to become wealthy (see the previous point) here are 4 Simple Habits to Build Wealth Faster. As mentioned in the article, there is a new edition of one of my all-time favorite financial books, The Millionaire Next Door.
Business Insider did an article on The Next Millionaire Next Door (I have purchased it, but haven’t read it yet) and posited 6 traits of the wealthy:
- Frugality, or a commitment to saving, spending less, and sticking to a budget
- Confidence in financial management, investing, and household leadership
- Responsibility, which involves accepting your role in financial outcomes and believing that luck plays little role
- Planning, or setting goals for your financial future
- Focus on seeing tasks through to their completion without being distracted
- Social indifference, or not succumbing to social pressure to buy the latest thing
Eleventh, factor tilts in portfolios mostly haven’t worked in a while, but there is a new paper, Global Factor Premiums, with some really broad (both geographical and temporal) perspective. Eternal Market Patience Offers Eternal Rewards is a summary of that paper.
One of the things that I occasionally worry about is that factor tilts are so well-known now that they will stop working. In other words, if “everyone” knows value beats growth, then they should tilt portfolios that direction leading the effect to disappear (because the demand for value stocks will drive up prices and lower future returns and vice versa for growth). Of course, if you have a value portfolio and then people jump on the bandwagon you will experience very nice returns while moving toward that state of no excess returns going forward.
However, it looks like my concerns are unwarranted (at the moment anyway). This paper shows that while active growth funds hold growth stocks, active value funds surprisingly don’t tilt to value stocks.
Note that even with perfect foresight, you have poor periods.
Twelfth, over dinner with some other advisors recently the subject of company cars as a perk came up and I thought my analysis might be interesting to you. This is just the math, I’m leaving aside any psychology of how people might feel about having a company car, and I assume that they will drive the same vehicle regardless of whether it is a company car or a personal car used for business. I’m also going to assume that people follow the law and if they drive a personal car for work they are reimbursed at the standard mileage rate by the company, and if they drive a company vehicle personally they reimburse the company for that usage at the same rate.
The cost of operating a vehicle can be broken down into mileage and time. In other words, a vehicle costs money to operate in relation to miles driven, and it depreciates with miles driven, and it also depreciates with the mere passage of time and will need some maintenance and insurance even if not driven at all. So we can think of the cost of ownership as being equal to $X/mile + $Y/year (and there might be an interaction between the two, but I’ll leave it in a simplistic form).
The IRS mileage formula ignores all actual costs of ownership and just uses an average cost per mile ($0.58 in 2019). This means that for expensive cars (e.g. luxury cars), high operating cost vehicles (e.g. large pickup trucks), or vehicles which are rarely driven (or some combination of those three, such as a new Lamborghini only driven a few times per year) the IRS number is too low. Of course, the reverse is true also, for cheap cars with great gas mileage that are driven a lot the IRS number is too high.
If you are going to drive a car that is higher cost than the mileage rate the company should own it and you reimburse the company at the standard rate for the personal miles. If you are going to drive a car that is less costly than the mileage rate you should own it and be reimbursed by the company for your business usage.
In other words, if you want to drive a Lamborghini, it should be a company car and you should pay just $0.58/mile for personal usage (far below the actual cost). Conversely, if you are happy to drive a used Honda compact, you should own it personally and get paid $0.58/mile to do so (and make money at that rate).
The extra value (happiness) you receive from driving the Lamborghini is deductible to the business and untaxed to you so there is a net win. Conversely, the excess of the reimbursement on the used Honda is deductible to the company but not income to you, also a net win.
Thirteenth, Michael Mauboussin had another good paper, Who is on the Other Side?
Fourteenth, a few quotes that are about investing and financial planning while ostensibly not being about those topics at all (h/t Ryan Holiday).
It’s not what happens to you, but how you react to it that matters.
– Epictetus
Markets go up and down, but it’s your reaction that matters most.
You are only entitled to the action, never to its fruits.
– Bhagavad Gita
Good decisions/actions are correlated with good outcomes, but the correlation is less than one. “Investing” your life savings in lottery tickets is a bad decision even if you happen to win. Carrying P&C insurance on your house is a good decision even if it never burns down.
Self-sufficiency is the greatest of all wealth.
– Epicurus
Needing less is as effective as having more.
Time and patience are the strongest warriors.
– Leo Tolstoy
Compound interest.
No one saves us but ourselves / No one can and no one may.
– Buddha
Agency. People who believe they can affect their future are more successful than those who don’t. Similar to growth mindset.
Fifteenth, I updated all the pertinent spreadsheets on our web site with 2018 data. The following links are to the updated ones:
Sixteenth, the title is a little hyperbolic/click-baity, but still good stuff: The Twenty Craziest Investing Facts Ever
Seventeenth, here is a good reference when doing financial planning for clients in other locations where you may not know the tax situation.
Eighteenth, there is a very interesting new paper explores the equity risk premium and adds housing data to find an even larger housing risk premium. (Unfortunately, it is behind a paywall.)
I think the housing risk is understated in the paper (you can’t easily hold a diversified portfolio), nonetheless, asset ownership should probably be roughly 50/50 equities and real estate (any mortgages, etc. should be ignored for this computation) as the expected returns to housing and real estate are similar, but the correlations between the two are very low. (The paper doesn’t support this, but I think the Sharpe ratios of individually-owned real estate and equities are similar.)
Note that imputed rent for owner-occupied housing is part of the return to real estate. High returns to real estate don’t justify overconsumption – my rule of thumb that the value (not the mortgage) of your personal residence(s) should not exceed about 2x your gross wages (for typical situations with folks still working) is still pertinent.
Nineteenth, the Economist just printed a piece on the definition of value. I shared similar commentary (this) with my consulting clients last year, but I don't think I shared it here. Also, here is a good article on the definition of the quality factor.
Twentieth, you may or may not have heard of Friedrich (“F.A.”) Hayek, but he was an economist and philosopher who was renowned for his spirited defense of classical liberalism (i.e. free markets). His best known work is probably The Road to Serfdom (abridged copy here if you are interested) where his primary point is that government interference in markets inevitably distorts the price signals and reduces efficiency – in the case of communism to the point the economy doesn’t function. He explored this in depth in his Nobel Prize speech The Pretense of Knowledge. As you are undoubtedly aware, recognition of ignorance is one of my personal hobbyhorses, so I very much like Hayek.
Anyway, that is a longish set-up for this: Hayek died in 1992 but recently some of his books and papers were auctioned off. His personal copy of Adam Smith’s The Wealth of Nations was expected to go for between $4,000 and $6,000. But it actually went for almost $200,000. Many of his other items apparently went for 10 to 20 times estimates. So, in other words, the very smart people at Sotheby’s couldn’t get even close to an accurate estimate of the value in the absence of an actual market transaction – eloquently making Hayek’s lifelong point! I find the irony very amusing. (h/t Marginal Revolution)
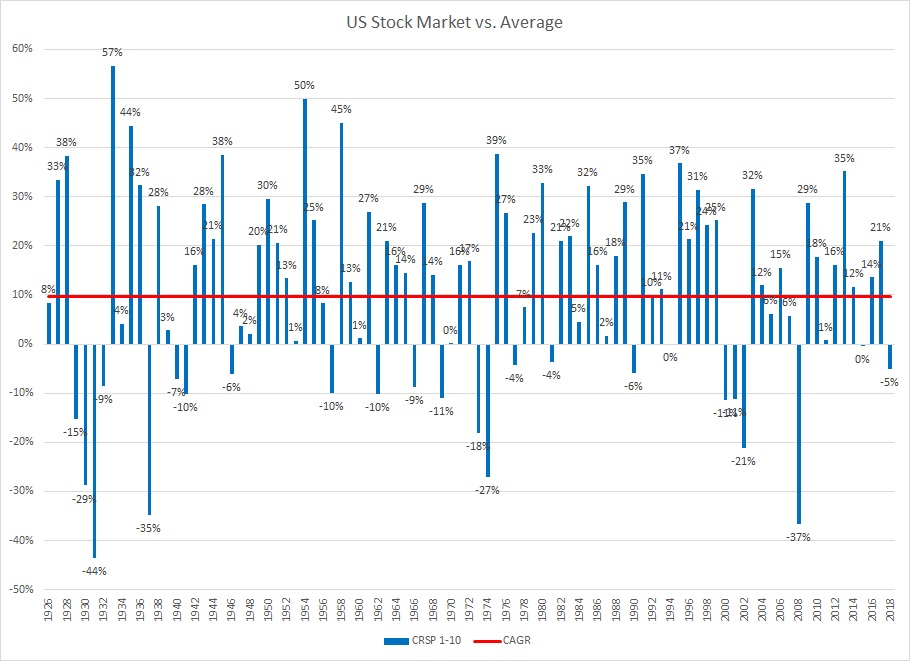
Twenty-first, here are the calendar year returns of the U.S. Stock Market (CRSP deciles 1-10) from 1926-2018:
The average compound return (i.e. geometric) is 9.75% (red line). Only in 1992 did an annual return round to 10%.
In only 5 out of the 93 years was it even within two percentage points of that (i.e. between 7.75% and 11.75%).
So the first lesson is that the market is almost never what people consider “normal.”
The second lesson is that the range of returns is likely much higher than you think. The worst calendar year was -44% (1931) and the best was 57% (1933) – peak to trough, or annually by month or day would be even more extreme, these are just calendar years.
The third lesson is that there aren’t any patterns. Cover the right side with your hand and try to predict the next returns by looking at the past ones (without cheating by knowing what happened historically). No predictability, despite common thinking that there are bull markets and bear markets with some sort of regularity.
Finally, this isn’t a lesson, but I feel compelled to remind my readers that just because the historical average was 9.75% that in no way implies that will be the average in the future. I (and most serious/knowledgeable analysts) believe future returns will almost certainly be lower. In other words, as the disclaimers say (accurately): “Past performance is no guarantee of future results.” Your mileage may vary.
Twenty-second, we strive for work/life harmony here at Financial Architects (rather than work/life balance) and so I liked this quote:
The master in the art of living makes little distinction between his work and his play, his labor and his leisure, his mind and his body, his information and his recreation, his love and his religion. He hardly knows which is which. He simply pursues his vision of excellence at whatever he does, leaving others to decide whether he is working or playing. To him he’s always doing both.
– James A. Michener
Finally, my recurring reminders:
J.P. Morgan’s updated Guide to the Markets for this quarter is out and filled with great data as usual.
Jonathan Clements, Morgan Housel, and Larry Swedroe, all continue to publish valuable wisdom. Just a reminder to go to those links and read whatever catches your fancy since last quarter. (There is no way to filter for just Jonathan Clement’s posts – that I can find anyway – so you have to search manually.)
That’s it for this quarter. I hope some of the above was beneficial.
Addendum:
If you are receiving this email directly from me, you are on my list of Financial Professionals who have requested I share things that may be of interest. If you no longer wish to be on this list or have an associate who would like to be on the list, simply let me know.
We have clients nationwide; if you ever have an opportunity to send a potential client our way that would be greatly appreciated. We also have been hired by some of our fellow advisors as consultants to help where we can with their businesses. If you are interested in learning more about that arrangement, please let us know.
We also offer a monthly email newsletter, Financial Foundations, which is intended more for private clients and other non-financial-professionals who are interested. If you would like to be on that list as well, you may edit your preferences here.
Finally, if you have a colleague who would like to subscribe to this list, they may do so from that link as well.
Regards,
David
Disclosure
|