|
Financial Professionals Summer 2021
This is my quarterly missive intended primarily for my fellow financial professionals wherein I share items I have run across or thought about this quarter which I think might be beneficial to you. Enjoy!
We occasionally take consulting clients (typically RIA firms). The annual retainer for this is generally the square-root of your AUM (with a minimum of $10,000 and maximum of $50,000). For more details or to discuss further, please e-mail or call me at 770-517-8160. – David
First, good case study of various retirement plan issues here.
Second, I liked five indicators of a smart person and seven indicators of a rich person.
Third, more evidence that success is cultural. Along those same lines, I have been thinking a lot about the determinants of financial success. This is new, although I’ve written similar things before:
Aristotle believed that our goal should be eudaimonia which is frequently translated as “happiness” but what he meant was much closer to well-being or human flourishing. Before Financial Architects existed I briefly thought of naming it Eudemonic Wealth Management (eudemonic means “conducive to” eudaimonia) – fortunately wiser people than I suggested not naming the firm something virtually no one knew or could spell!
Anyway, how did Aristotle believe eudaimonia was to be achieved? He believed that right actions were usually a golden mean or a middle way; that virtue lay midway between two vices. (For more, see this for example.)
You are probably wondering what all of this has to do with financial planning. I believe the virtue of wealth (having enough) is between the two vices of profligacy (over-spending) and miserliness (over-saving). I also want to note that having “enough” is not entirely income related: there are lots of high-income broke (i.e. don’t have enough) people as well as low-income not-broke (i.e. have enough) people. My definition of “enough” is whether someone is likely to have to dramatically curtail their lifestyle (whatever it is) in the future.
Merely by nature of our business, we and our clients have much higher savings rates and wealth levels than the vast majority of society. Those less-well-off people generally think that they should have more money, but they also would, in most cases, spend the money if they had it. You can’t both have the money and spend it though! They want to be millionaires (or more) not to have a million dollars, but so they can spend a million dollars on the things they think millionaires have and do. But then, ipso facto, they would no longer be millionaires, they would be poor again!
In addition, that desire to be wealthy is usually only a wish, not a real desire. Let me use an example from another area of life. Many Americans (myself included), could stand to lose a few pounds. We want to be thinner, but in sort of an abstract way – we don’t really want to eat less or exercise more (or we would). In much the same way, many Americans want to be wealthier – but they don’t want to spend less or work harder.
Before I go on, I want to put a little disclaimer here. From my perspective most people (not most of our clients, most people in the U.S.) are spendthrifts. From their perspective I am a miser (and you probably are too). If the goal is to maximize happiness, we could very well all be right. “They” maximize happiness by living for today and “we” maximize happiness by knowing the future is relatively secure. The following comments are descriptive not normative. In other words, I’m stating what is necessary to build wealth; I’m not saying that building wealth is, or should be, the goal for everyone. There is no way for anyone to make that claim either way for other people. When I was younger, I would think “those people should…” where now, older and (perhaps) wiser, I more often think, “those people are making choices I wouldn’t make, but it must work for them…”
That said, I’ve given a lot of thought over the years to what causes some folks to build wealth while others don’t. I think there are two elements: time horizon and locus of control. I’ll elaborate on those further below.
Time Horizon
Consider a few things that most of us would consider mistakes in most cases (or at least pretty suboptimal):
- Carrying credit card debt at 18%
- Not contributing to a retirement plan (not even for the match)
- Working a “dead-end” job (and not trying to change the situation)
- Overspending on luxury goods
I would submit that all of those are great financial decisions – if the universe ends on Tuesday. They are only bad decisions if it doesn’t.
Once I saw this, it explained a lot of decisions that people make that seemed obviously foolish to me. They aren’t foolish necessarily; the folks making them just have a very short time horizon. You can equate this to discount rate too. A short-term horizon is the same as a high discount rate. If someone has a 30% discount rate, then 18% credit card debt is a screaming deal. If someone has a 3% discount rate, then paying down on a mortgage at 4% is attractive.
Now, obviously, there are life situations where people are hindered from doing what they “should” do, but ceteris paribus short-term thinkers will do the things on that list and long-term thinkers won’t.
On the flip side a person could have a time horizon/discount rate that is arguably too long – these folks are misers who will never spend any of their money because they “might need it later.” In the United States today people with this inclination are pretty rare. The people who aren’t saving enough for the future seem to vastly outnumber those who are saving too much. (Again, from my perspective of what’s “enough” and “too much.”)
Locus of Control
A person with an internal locus of control believes they can affect what happens. A person with an external locus of control doesn’t think they can. The “sweet spot” is in the middle with a locus of control that is correctly calibrated. If you think saving is pointless because even if you save something will happen and you will lose all your money anyway, then you have an external locus of control and you are unlikely to save. On the other hand, if you think you are planning for retirement, not by saving in a diversified portfolio, but by simply buying a penny stock or lottery tickets because you believe you can (against all evidence) pick winning stocks or lottery numbers, then you have a locus of control that is too high.
Let me try to explain this another way. A high school student does poorly on a test:
- External locus of control response: “That teacher always hated me.”
- Excessive internal locus of control response: “Despite my failing grades I don’t need to study to succeed. I’ve got this.”
- Appropriate internal locus of control response: “I need to study harder next time.”
Appropriate internal locus of control folks “own it” and do the necessary work while external locus of control folks “blame” their situation on others. As adults, the three students above grow up and take the following approaches to retirement:
- External locus of control attitude: “The world is rigged against me and I’ll never get ahead so there’s no point in saving.”
- Excessive internal locus of control attitude: “I don’t need to save much (or at all); I’ll just be sure to buy investments that will have at least 100% annual returns.”
- Appropriate internal locus of control attitude: “I’ll save prodigiously and invest in a prudent and diversified portfolio so I can retire comfortably someday.”
Now, I should note that there are people who have an external locus of control and it is appropriate. If you live in a repressive or authoritarian country or are in the middle of a natural disaster or war, you frequently can’t get ahead by your own work. In some cultures and families, if you are the one who “does well” you are expected to support others who haven’t done as well (even if it is self-inflicted). If every time you scrape together a few dollars of savings other people feel entitled to it, then it’s hard to get ahead. Your success isn’t in your hands if there are excessive demands from your loved ones.
But assuming 1) you live in a country with a relatively free and stable economy, 2) you are capable of working, and 3) you don’t have family and friends who will feel entitled to any wealth you accumulate (or you can say “no”), then financial success is just a matter of having a long time-horizon and internal locus of control. With those traits, building wealth is almost inevitable; without them, it’s almost impossible.
Fourth, people believe crazy things (source), such as:
- You only need to save 5 times your salary to retire comfortably
- You can withdraw 10% to 15% of your savings each year in retirement
- Stock market returns are mostly negative
- Healthcare costs won’t be massive in retirement
- You can retire at 62 and get the full amount of Social Security benefits you’re eligible for
Fifth, it’s interesting to think about bitcoin as chain letter. Also, since it would be irrational to have much confidence in any prediction, the math says you should hold a very, very small amount if any at all. Also:
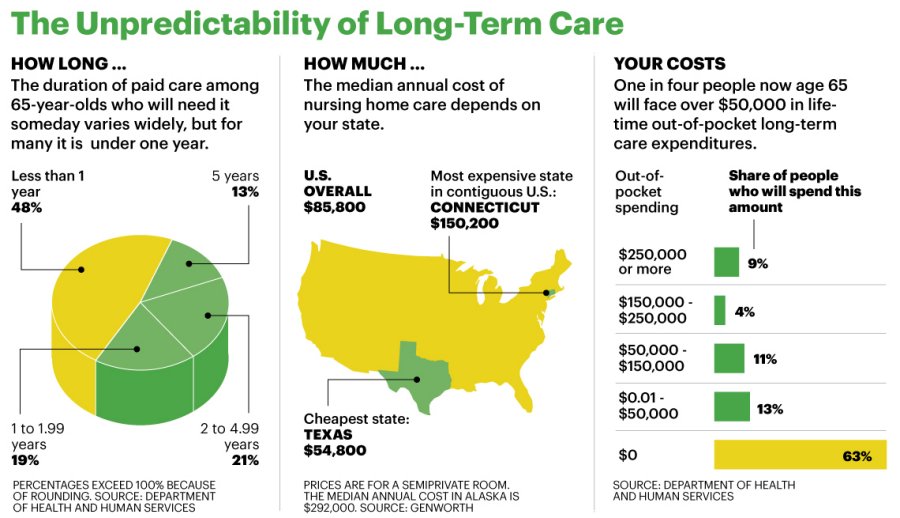
Sixth, great graphic from AARP:
Seventh, here are some good expositions of chart crimes (and a history of charts).
Eighth, good summary of the bill that passed in December that had tax (and other) changes.
Ninth, good overview of estate tax proposals. That is the Sanders proposal so that’s the worst-case scenario. What gets enacted (if anything) would likely not be as bad. One thing I hadn’t realized is that the $3.5mm exclusion was not indexed for inflation.
In light of the Sanders proposal, etc. I was curious what the real historical estate tax exclusions have been so I made a quick spreadsheet and deflated the numbers by CPI. it rarely exceeded $1,500,000 (just three years in the late 1920’s) until 2004 (and averaged about $800,000 up to that point). Going back to $3.5mm with no inflation adjustment (the Sanders proposal) would be much better than every year prior to 2011 and much worse than every year after 2010.
While I disagree with the tax-the-rich slant of this piece, it does provide a good thumbnail history of the estate tax exclusion amount.
To help your clients play defense, see What Advisors Need to Know About Estate Planning and The Estate Planning Implications of Biden’s Recently Issued Green Book.
Tenth, there is more on potential tax law changes here and here.
The refundable saver’s credit would be great for those of us with children with no tax due, but with earned income funding Roths. That is more speculative though than the immediate retirement bill changes.
And here’s an article on capital gains nonsense.
Eleventh, Robert Shiller gives us a history lesson here. I could see “I Faw Down an’ Go Boom” (1929) being a catchphrase on WSB when people’s stocks crash. Plus ça change, plus c’est la même chose.
Twelfth, good perspective on risk from a NYT article (see also here):
Guido Calabresi, a federal judge and Yale law professor, invented a little fable that he has been telling law students for more than three decades.
He tells the students to imagine a god coming forth to offer society a wondrous invention that would improve everyday life in almost every way. It would allow people to spend more time with friends and family, see new places and do jobs they otherwise could not do. But it would also come with a high cost. In exchange for bestowing this invention on society, the god would choose 1,000 young men and women and strike them dead.
Calabresi then asks: Would you take the deal? Almost invariably, the students say no. The professor then delivers the fable’s lesson: “What’s the difference between this and the automobile?”
Thirteenth, here’s two ESG investing articles:
Are You Trying To Make Money Or Save The World? and Does “ESG” Spell “Embellished Shiny Grading?”
Fourteenth, value investing has been doing much better recently and Vanguard says: “[W]e expect value to outperform growth over the next 10-year period by as much as 5% to 7% per year and perhaps by even more over the next five years.”
Fifteenth, excellent expansion of Bessembinder’s research showing most stocks lose money (which I covered here) from John Rekenthaler here.
Sixteenth, Medicare vs. Large Group Costs (not premiums):
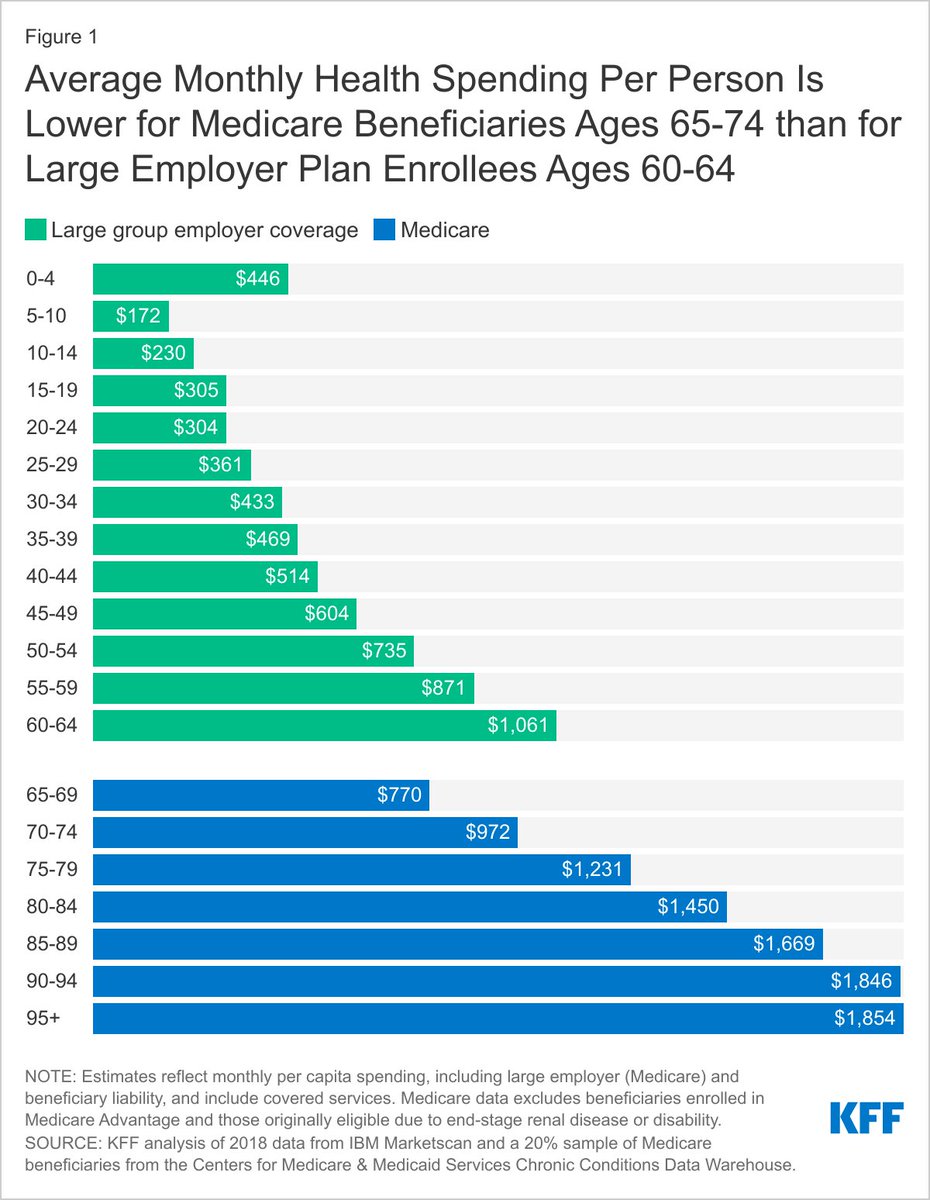
As you can see, Medicare doesn’t pay as much as private insurance does.
Seventeenth, you may have read Thinking, Fast and Slow. (That title still drives me bananas. It’s a grammar error in the title fer cryin’ out loud! Those are adverbs people!) Anyway, a good analysis here of what has changed in 10 years (a lot has been debunked or seriously weakened).
Eighteenth, new Social Security statements are coming. Examples here.
Nineteenth, Chicago Booth hosted a discussion between three giants of investing: Asness, Booth, & Fama. I watched it live not knowing it would be available later. It’s very good and available for your viewing pleasure here.
Twentieth, a (very astute) client e-mailed asking if I had seen this article. My reply (indentation omitted and lightly edited):
That’s actually a very well-known effect (well, among people who know the math on MCS which may not be that many folks!). I’ve known (and taught) it for about 20 years now.
What it means is that if you have a prudent financial plan, with no legacy desires, you very well might accidentally leave your heirs an estate large enough to have an estate-tax problem anyway!
I know Michael did the math, but I’m going to do it myself just to reiterate the point.
Using 1926-2020 data on stocks (CRSP1-10), bonds (5YR TSY), and inflation (CPI) the real arithmetic mean was 8.8% for stocks with a standard deviation of 18.4% and 2.3% for bonds with a standard deviation of 4.7% (all annualized from monthly data by compounding the monthly return and by multiplying the volatility by the square root of 12). The correlation between stocks and bonds was 8.1%. That gives us these portfolio options:
Stock%: |
100% |
80% |
60% |
40% |
20% |
0% |
Arith. Return: |
8.8% |
7.5% |
6.2% |
4.9% |
3.6% |
2.3% |
Risk (Sigma): |
18.4% |
14.9% |
11.4% |
8.1% |
5.5% |
4.7% |
Geo. Return: |
7.14% |
6.43% |
5.59% |
4.60% |
3.47% |
2.21% |
If I do 5,000 trials in our MCS with those figures using $1,000,000 as the starting value and $40,000 for an annual withdrawal (starting immediately) then this is exactly the 4% rule done with a MCS using historical returns to generate many more scenarios than we actually had historically. (Also, if you use rolling historical data, you over-sample the middle years and under-sample the beginning and ending years). I don’t have to inflation-adjust the withdrawals because I used real returns in the first place. Looking at the results at the 30-year horizon (again to match the Bengen research), the success rates range from 91% for all stock up to 97% for 40/60 and then back down to 79% for all bond. I’ll focus on the 60/40 here. It has a success rate of 95%. I would say that validates the 4% rule pretty well – though expected real returns might be a little lower than historical realized real returns, this has no international diversification, no factor tilts, etc. but also no fees. Close enough probably to assume all of that roughly cancels out.
While this scenario runs out of money 5% of the time, in the median (middle) case (no one computes an average because of the skew in results that we are talking about) there is just under $2,000,000 (and, to reiterate, all of this is stated in real dollars). The 5% case (the 1-in-20 on good side) had an ending value of about $7,500,000, while the 95% case (the 1-in-20 on the other end) is zero and the 50th percentile (the middle case or median) is about $2,000,000.
Doubling everything so a hypothetical single client had a $2,000,000 portfolio to start with and withdrew $80,000/year (adjusted for inflation) to live on in retirement (and had no other assets), 30 years in there is an equal chance of zero and $15,000,000! The estate tax exemption is scheduled to revert to $6,000,000 (ish) and increase with inflation so we can compare our $15,000,000 to that $6,000,000 since both are real. $15,0000,000 minus $6,000,000 is an estate that would owe taxes on $9,000,000. At the current 40% rate, that is a $3,600,000 estate tax bill! To flog the deceased equine further, to have “only” a 5% chance of running out of money, there’s a 5% chance of pretty significant estate tax issues. (Of course in real life you see how it’s unfolding and adjust spending, gifting, etc. to ameliorate both extremes.)
So here’s an easy rule of thumb. If you use the 4% rule for spending, with a starting 60/40 portfolio value of $X, in 30 years you have (in real dollars):
- A 1/20 (5%) chance of $0
- A median (50th percentile) value of $2X
- A 1/20 (5%) chance of $7.5X or more
Twenty-first, we are bombarded with so-called “information” but the signal-to-noise ratio seems lower than ever. The “flood the zone” and “big lie” approaches threaten to overwhelm us. Here are a few rules to help us simplify and filter:
Hanlon’s razor – Never attribute to malice that which is adequately explained by stupidity.
Hitchen’s razor – What can be asserted without evidence can also be dismissed without evidence.
Occam’s razor – The simplest explanation is usually the correct one.
Popper’s falsification principle – In so far as [a statement] is not falsifiable, it does not speak about reality.
Sagan’s standard – Extraordinary claims require extraordinary evidence.
With those rules we can simply ignore a lot!
Twenty-second, there seems to be view (particularly on the left) that some wealth distributions are grossly unfair (and government should do something about it), but they have not thought through the implications of their beliefs.
Take whatever distribution you think is the outer limit of fair, for example suppose you think no one should have more than $1billion dollars net worth or less than $100,000 of net worth. Or (equivalently) no one should have a net worth in excess of 10,000 times someone else’s. The actual distribution doesn’t matter. It could be that everyone should have exactly the same amount, whatever. As long as you think there should be some limit on either end (I’ll use the $X for the top end and $Y for the bottom end) then:
- If you are at $X maximum you are (functionally) not allowed to work or invest. If you do so you would go over the limit.
- If you are at the $Y minimum you are not allowed to spend any of your money because then you would be under the minimum. So you really don’t have $Y since you aren’t allowed to spend it!
- Suppose the $X person is an entertainer and wants to do a show, and suppose the $Y person wants to pay to go to the show. The tickets are $1. They are not allowed to transact! Even though both would like to, it would be illegal if you really believe that no one should have more than $X or less than $Y.
- If “everyone” gets $Y net worth regardless of what they do then they should spend extravagantly and the government will give them back what they spend because they would be below the minimum “fair” amount.
- Alternatively, if “everyone” gets $Y net worth regardless of what they do then they could take that $Y and buy deep out of the money options (or lottery tickets, or whatever). If they win, then they are rich, but if they lose the government gives them the money back!
This is insanity!
Twenty-third, a paper on Total Returns to Single Family Rentals had some interesting data.
From page 17, City-Level Stylized Facts: To summarize, the city-level stylized facts describing total returns and their components in U.S. data from 1986 to 2014 are as follows:
- Gross and net rental yields tend to decline with price.
- Conversely, realized house price appreciation was higher in higher-price-tiers.
- Together, these results imply that there is less cross-sectional dispersion in total returns than in either of its components.
- House price appreciation appears to be more volatile in time series data than are rental yields. As a result, measured Sharpe ratios are higher for cities with higher contributions to returns from rental yields.
From page 21, Zip Code-Level Stylized Facts:
- Net rental yields decline with house prices within cities.
- House price appreciation does not increase with house prices within cities.
- As a result, total returns decline with house prices within cities.
- There is more measured dispersion in house price appreciation across cities than within cities across zip codes. Zip code-level house price appreciation appears to be tightly linked to city-level outcomes.
- By contrast, the dispersion in yields is of similar magnitude at the zip code and city levels.
Appreciation and cash flow are about equal contributors to total return. Also, expenses (insurance, taxes, vacancy, property manager, repairs) are about 40% of gross rents.
Twenty-fourth, there has been a lot of press about how little tax wealthy folks pay. Most recently these articles have used silly assumptions that suppose some alternative tax code that taxes unrealized gains and then computes how low the rate would be for some prominent wealthy folks if that were how taxes were computed. Well, I can do extreme cases too. The calculations below are based on the actual tax code though – let’s see how high tax rates really are for wealthy people by going all the way from a company earning $1,000 to what the heirs of our taxpayer will eventually receive!
Assume a taxpayer at the top rates who lives in CA and owns stock in a company also located in CA:
- The company earns $1,000; pays 21% federal and 8.84% state income taxes leaving $701.60 in the company coffers to be paid as a dividend.
- The owner of the stock gets a $701.60 dividend and pays 23.8% federal and 13.3% state income taxes leaving $441.31 to the taxpayer.
- Taxpayer dies and the estate pays 40% estate taxes on that remaining amount leaving the heir with $264.78.
- So from the original $1,000 earned by a company a high income/wealth CA taxpayer would leave just $264.78 to heirs. That is a total tax rate of 73.52%.
But it gets worse. That is the current tax rate. If the proposed Biden tax increases are enacted then the corporate rate goes from 21% to 28% and the top capital gain rate would go from 23.8% to 43.4%. So let’s do the math on that:
- The company earns $1,000; pays 28% federal and 8.84% state income taxes leaving $631.60 in the company coffers to be paid as a dividend.
- The owner of the stock gets a $631.60 dividend and pays 43.4% federal and 13.3% state income taxes leaving $273.48 to the taxpayer.
- Taxpayer dies and the estate pays 40% estate taxes on that remaining amount leaving the heir with $164.09.
- So from the original $1,000 earned by a company a high income/wealth CA taxpayer would leave just $164.09 to heirs. That is a total tax rate of 83.59%.
If you are a high income/wealth taxpayer, there is very little reason to earn money to invest with the idea of leaving more to your heirs.
Here’s the spreadsheet model:
Item |
Current |
Proposed |
Company Earnings: |
$1,000 |
$1,000 |
Federal Corporate Income Tax Rate: |
21% |
28% |
State Corporate Income Tax Rate (CA): |
8.84% |
8.84% |
Dividend to Taxpayer: |
$702 |
$632 |
Federal Qualified Dividend/Long-Term Capital Gains Rate: |
23.8% |
43.4% |
State Qualified Dividend/Long-Term Capital Gains Rate (CA): |
13.3% |
13.3% |
Net Income to Taxpayer: |
$441 |
$273 |
Federal Estate Tax Rate: |
40% |
40% |
Net to Heirs: |
$265 |
$164 |
Effective Total Tax Rate: |
73.52% |
83.59% |
(Note that the calculations do not change if the company does not pay a dividend. In that case the value of the stock is higher by the amount of the unpaid dividend and since the tax rates on long-term capital gains and qualified dividends are the same the math is identical. And with the proposed loss of the step-up in basis it would be taxed at that level too. It seemed a little easier to follow if I paid out the dividend though.)
You might think this is so egregious simply because I used CA for the state taxes. If I used GA it looks like this:
Item |
Current |
Proposed |
Company Earnings: |
$1,000 |
$1,000 |
Federal Corporate Income Tax Rate: |
21% |
28% |
State Corporate Income Tax Rate (GA): |
5.75% |
5.75% |
Dividend to Taxpayer: |
$733 |
$663 |
Federal Qualified Dividend/Long-Term Capital Gains Rate: |
23.8% |
43.4% |
State Qualified Dividend/Long-Term Capital Gains Rate (GA): |
5.75% |
5.75% |
Net Income to Taxpayer: |
$516 |
$337 |
Federal Estate Tax Rate: |
40% |
40% |
Net to Heirs: |
$310 |
$202 |
Effective Total Tax Rate: |
69.04% |
79.79% |
OK, but what about FL with no individual income taxes at all?
Item |
Current |
Proposed |
Company Earnings: |
$1,000 |
$1,000 |
Federal Corporate Income Tax Rate: |
21% |
28% |
State Corporate Income Tax Rate (FL): |
5.50% |
5.50% |
Dividend to Taxpayer: |
$735 |
$665 |
Federal Qualified Dividend/Long-Term Capital Gains Rate: |
23.8% |
43.4% |
State Qualified Dividend/Long-Term Capital Gains Rate (FL): |
0.00% |
0.00% |
Net Income to Taxpayer: |
$560 |
$376 |
Federal Estate Tax Rate: |
40% |
40% |
Net to Heirs: |
$336 |
$226 |
Effective Total Tax Rate: |
66.40% |
77.42% |
(The FL corporate tax was 5.5% prior to 2019 and is scheduled to be that again after 2021, so I used that rate.)
Of course a company could be in one state and the taxpayer in another so in real life the figures could mix-and-match.
CA is not even the worst, the top income tax rate in New York city and state combined is 14.776%. It also has an estate tax maximum of 16%. The corporate income tax rate is 7.25% plus as much as 9% (it’s complicated).
Going back to my very first (CA) example, if the corporation retains the earnings (no dividend) so that the value of the company is higher by the amount of the unpaid dividend, then under current rules there is a step-up in basis if the stock is left to an heir. In that case the comparison looks like this:
Item |
Current |
Proposed |
Company Earnings: |
$1,000 |
$1,000 |
Federal Corporate Income Tax Rate: |
21% |
28% |
State Corporate Income Tax Rate (CA): |
8.84% |
8.84% |
Value to Taxpayer: |
$702 |
$632 |
Federal Qualified Dividend/Long-Term Capital Gains Rate: |
0.0% |
43.4% |
State Qualified Dividend/Long-Term Capital Gains Rate (CA): |
0.0% |
13.3% |
Net Income to Taxpayer: |
$702 |
$273 |
Federal Estate Tax Rate: |
40% |
40% |
Net to Heirs: |
$421 |
$164 |
Effective Total Tax Rate: |
57.90% |
83.59% |
Let me make it even worse! Suppose the value of the stock was $50,000 and inflation was 2%. In that case, in real economic terms the taxpayer made nothing ($1,000/$50,000=2%) yet would pay anyway. This is why tax sheltered retirement accounts are so vital. There is no tax on the phantom income if it is in a Roth or an IRA (with no basis) for the taxpayer (the corporate tax may still be on phantom income though). The Roth math for the tax rate is the same as the step-up version above. (The IRA math is too, but it is much harder to demonstrate that so just trust me.)
Twenty-fifth, someone just has to sell an NFT of this. Then someone should sell an NFT of that NFT, ad infinitum. An endless regress of nothingness.
Twenty-sixth, From Which Kind of Trust Is Right for Your Client? 9 Questions to Ask, the first seven questions are useful (the last two are funding methods, not pertinent to needing a trust) to get clarity on what the client is trying to accomplish:
- Are You Trying to Avoid Estate Taxes?
- Do You Want to Protect Your Assets from Creditors and Lawsuits?
- Do You Want to Provide for Minor Children?
- Do You Want to Provide for Your Grandchildren?
- Do You Want to Leave a Charitable Legacy?
- Are You Worried About What Will Happen to Your Assets if You Become Incapacitated?
- Do You Want to Limit the Control Your Spouse Has Over the Assets in the Trust?
I would add:
- Are You Trying to Provide for Someone with Special Needs Who Receives Government Benefits?
Twenty-seventh, given the excitement in the media about recent inflation numbers I thought some data might be helpful (click for larger image):

I started the graph in 1980 because inflation was very different before that and it is on a log scale with a trendline added. On a log scale constant inflation would show as a straight line; the concavity is because we have had disinflation (i.e. the first derivative of inflation has been negative).
Twenty-eighth, good summary of inherited retirement plan payout options here.
Twenty-ninth, I saw a nice source of data for state retirement taxes here. If you prepare financial plans for people in other states (as we do) this may be helpful.
Thirtieth, some DFA folks wrote a good paper on portfolio rebalancing, but the conclusion is that most any reasonable method is roughly equivalent.
Thirty-first, some great quotes on prediction (source):
Peter Bernstein:
Even the most serious efforts to make predictions can end up so far from the mark as to be more dangerous than useless. – Peter Bernstein
Our expectations of the future are not unbiased and do not reflect all available information. – Peter Bernstein
Warren Buffett:
Forecasts usually tell us more about the forecaster than of the future. – Warren Buffett
I am certainly not going to predict what general business or the stock market are going to do in the next year or two since I don’t have the faintest idea. – Warren Buffett
The fact that people will be full of greed, fear, or folly is predictable. The sequence is not predictable. – Warren Buffett
Ben Graham:
Economic events rarely unfold in the way stock-market people forecast them. – Ben Graham
I am skeptical about stock market forecasting by anybody, and particularly by bankers. – Ben Graham
If we really knew what the future will bring that is all we would have to know; but since stock market people can only guess the future and since they have the embarrassing habit of guessing wrongly, it seems best not to lay too much stress upon forecasts. – Ben Graham
No one really knows anything about what will happen in the distant future, but analysts and investors have strong views on the subject just the same. – Ben Graham
Peter Lynch:
No one can predict with any certainty which way the next 1,000 points will be. Market fluctuations, while no means comfortable, are normal. – Peter Lynch
There are economic facts and there’s economic predictions and economic predictions are a total waste. – Peter Lynch
You never can predict the economy. You can’t predict the stock market. – Peter Lynch
John Templeton:
In all my 60 years in the stock market, I never found anyone whose opinion of what the stock market would do next week or next month was worth heeding. – John Templeton
The influence on stock prices are so numerous and so complex that no person has ever been able to predict the trend of stock prices with consistent success. – John Templeton
There will be bear markets about twice every 10 years and recessions about twice every 10 or 12 years but nobody has been able to predict them reliably. So the best thing to do is to buy when shares are thoroughly depressed and that means when other people are selling. – John Templeton
Others:
Attempting to guess short-term swings in individual stocks, the stock market or the economy is not likely to produce consistently good results. Short-term developments are too unpredictable. – Lou Simpson
Extrapolation is usually right, but not valuable, and predictions of deviation from trends are potentially profitable but rarely right. So far, macro-economic forecasting doesn’t represent the path to superior investments. – Howard Marks
In my view, predicting future private market value is like predicting future Dow Jones levels: It doesn’t make any sense at all. – Seth Klarman
No one can look ahead five or ten years and say what is the most promising industry or the best stock to own. – T. Rowe Price
No one, not even the most experienced trader, economist or businessman can predict with certainty the course of the stock market. – Bernard Baruch
Nobody knows what the stock market is going to do or even what it ought to do. Hence, the most valuable asset in all business, which is knowledge, is necessarily absent. – Edwin Lefevre
We deceive ourselves when we believe that past stock market return patterns provide the bounds by which we can predict the future. – John Bogle
Finally, my recurring reminders:
J.P. Morgan’s updated Guide to the Markets for this quarter is out and filled with great data as usual.
Morgan Housel and Larry Swedroe continue to publish valuable wisdom. Just a reminder to go to those links and read whatever catches your fancy since last quarter.
That’s it for this quarter. I hope some of the above was beneficial.
If you are receiving this email directly from me, you are on my list of Financial Professionals who have requested I share things that may be of interest. If you no longer wish to be on this list or have an associate who would like to be on the list, simply let me know.
We have clients nationwide; if you ever have an opportunity to send a potential client our way that would be greatly appreciated. We also have been hired by some of our fellow advisors as consultants to help where we can with their businesses. If you are interested in learning more about that arrangement, please let us know.
We also offer a monthly email newsletter, Financial Foundations, which is intended more for private clients and other non-financial-professionals who are interested. If you would like to be on that list as well, you may edit your preferences here.
Finally, if you have a colleague who would like to subscribe to this list, they may do so from that link as well.
Regards,
David
Disclosure
|