My last post mentioned at the end that many people purchase annuities for the guarantees. I thought I would expand on that by posting here an analysis I did a few years ago of some examples of “market linked” or “equity linked” products with some sort of guarantee. These “guarantees” are attractive propositions to those who are understandably gun-shy after watching the market plummet by about half. They aren’t outright theft in the way that schemes perpetrated by Bernie Madoff, Allen Stanford, and others are, but they are harmful to investors all the same. These gimmicks are extremely popular in insurance products and perform similarly.
Product One
An advisor at one of the largest investment firms emailed the pitch below to his clients recently. The firm’s name has been removed to protect the guilty, but it is otherwise unchanged:
[Firm Name] is rolling out our market linked CD today:
(Get market performance on your insured CD without risk of losing $)
* Must be purchased by September 8, 09.
* Linked to S&P
* Approximately 5.5 yr term
* Performance Cap: 45-65%.
* FDIC Insured? Yes up to $250K
* Downside risk: None, if S&P has a negative return at end of term, 100% of principal is returned.
* Minimum purchase: $ 4000.
The blue line was blue in the original, presumably for emphasis, even though it is clearly inaccurate. “Market performance” is simply not available without risk in this product or any other. The performance cap ended up being 60%, as it had been in earlier offerings, which is obviously not “market performance.” Now, here are the problems:
- The tax treatment is horrible. Owning stocks gives capital gains. This product delivers all ordinary income, which is taxed at a higher rate. Worse, the investor is taxed on the income during the 5½ year term even though nothing is received until the end. (This is called “phantom income” in the tax world.)
- This product is massively illiquid. During the term, there is no active market in which to sell the CD and get the money back, and the investor is not able to cash it in prematurely. Hedge funds don’t even have 5½ year lockups.
- The “S&P” mentioned is the S&P 500 price only index. The S&P 500 was created in its current form on March 4, 1957. Using all of the monthly returns from April 1957 (the first full month after its creation) through August 2009 (the last full month before this CD was to be purchased), the average annual return for the S&P 500 was 9.65%. Without the dividends, it was only 6.13% – a not insignificant 3.52% annual difference.
- The gain is capped at 60%. In other words, compared to investing in the S&P 500 outright, in exchange for guaranteeing investors won’t lose money over a 5½ year period, the firm is taking 3.5% off the top (from the dividends) and then 40% of the rest of the return.
Of course, if investors are spared from some truly horrific results, it still might be worth it. But since the investor is only getting 60% of the returns, what if he or she simply put 60% of the funds in an S&P 500 index fund and the other 40% in something conservative like 5-year government bonds? On average, the CD would have returned 4.86% (annualized), the 60/40 portfolio 9.42%.
In short, the investor who bought into the pitch gave up an average of 4.55% per year (difference due to rounding) for the downside protection. Again, that may have been worth it if the protection was frequently needed or if when it kicked in it averted catastrophe. There were 564 rolling 5½ year periods from April 1957 through August 2009 (when I did this analysis). The CD outperformed the simple 60/40 portfolio … once – the period ending in September of 1974. Here it is graphically:
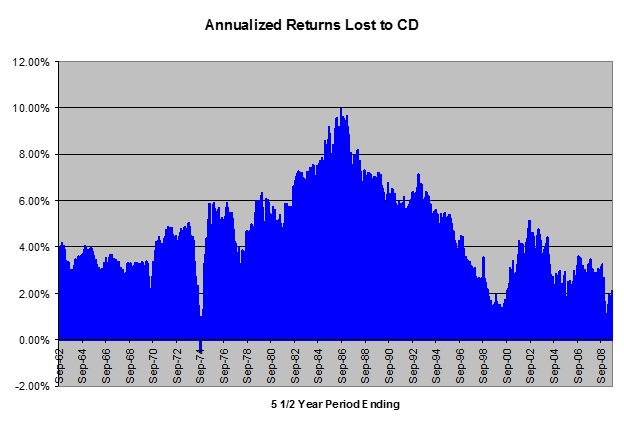
As you can see, generally it isn’t even close.
Product Two
Here is the description from the documentation:
The Notes Linked to the S&P 500® Index due August 29, 2014 are senior unsecured debt securities of [Wirehouse] that provide (i) the possibility of a return, subject to a cap, if the ending level of the S&P 500 Index (the “Index”) increases from the starting level, (ii) the possibility of an 8% contingent minimum return so long as the ending level of the index does not decline by more than 40% from the starting level, (iii) return of principal if, and only if, the ending level of the Index is not less than the threshold level and (iv) full exposure to decreases in the level of the index from the starting level if the ending level is less than the threshold level. If the ending level is less than the threshold level, you will lose some, and possibly all, of the original offering price of your notes. [To their credit, emphasis in the original.]
Here are the issues:
- It is massively illiquid with a four-year lockup of the investment.
- The “8%” return is holding period return (henceforth HPR) over four years – not annualized.
- The upside is capped at 60-70% HPR, or 13.34% annualized (using the midpoint of 65% for the calculations.)
- The tax treatment is ordinary income and is probably phantom income during the term (the IRS position is unclear).
- The investor is an unsecured creditor of the company issuing the note during the term since he or she doesn’t actually own the underlying investments.
Given those issues, ideally this is held in a tax sheltered account, the firm stays in business, the investor doesn’t need or want the funds for four years, and the S&P 500 performs as it has historically. Using month-end data for every rolling four-year period since the inception of the S&P 500 (March 1957), never (out of the 593 rolling periods) was the ending value of the S&P below 60% of the starting value over a four year period, so the massive downside never occurred and thus isn’t isn’t reflected in the analysis to follow, and the investment got “capped” at the 65% return 101 times (17 percent of the periods).
Essentially, this is a simple options strategy:
- Buy zero coupon bonds that at maturity will be worth 108% of the original investment.
- Buy a four year S&P 500 call with a strike price 8% above the current value. (8% was already received from the bonds; this gets the rest of the return.)
- Sell a four-year, European-style, call (that means it can only be exercised at expiration) with a strike price at 165% of the market value (this limits the upside to the cap).
- Sell a four-year, European-style put with a strike price at 60% of the market value (this captures the downside risk that exists with this product).
It looks pretty good at first glance. It never lost money; the worst return was 1.94% annualized – the 8% HPR – and it had average annual returns of 6.99%. While it certainly underperformed stocks, that isn’t an appropriate comparison since stocks experienced far more downside even over a four year period. In fact, the return on the note during that period is exactly the same as five year treasuries have earned, so it is far more similar to fixed income.
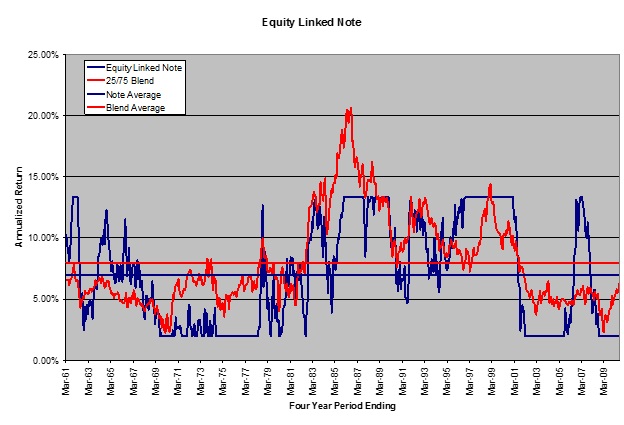
So what would be a fair comparison? I mixed investments in the S&P 500 (total return) and five year constant-maturity treasuries to get a portfolio of equivalent risk. A 25% stock/75% bond mix never had a return lower than 9.19% – higher than the 8% “guarantee” from the note, and of course this investment is much better in terms of liquidity, taxes, default risk, etc.
The returns on the 25/75 mix are one percent higher on average as well. So, when purchasing the note, essentially the investor gives up 1% on average in exchange for worse ancillary features. In addition, the risk, as measured by standard deviation, of the 25/75 mix is lower. This isn’t a great comparison because the note has the ends of the distribution truncated, which is why I used minimum return as the risk metric. The index data I used doesn’t have expenses, but since SPY (the S&P 500 ETF) has an expense ratio of 9 bps and an equivalent treasury ETF (the 3-7 year iShare) would be 15 bps it doesn’t change the conclusion at all.
Also, keep in mind that although the “knock-in” if the market is down in price by more than 40% (excluding dividends) never happened in the last 50 years of data used here, if it did happen the investor would get killed in this note versus the 25/75 mix. And “killed” is not an exaggeration (though it is clearly metaphorical).
To make the comparison fair, and incorporate that downside risk, the investor would buy the 25/75 mix and then sell four-year naked puts with a strike at 60% of the current price. I don’t know of many advisors who would think that was a prudent strategy. It would make the historical returns even better because the investor received the option premium and yet was never exercised upon.
Here is the graph of hypothetical historical performance, without including the extra income on the blend strategy from selling a naked put (essentially the red lines would be even higher):
Product Three
An advisor was extolling the virtues of “Reverse Convertible Notes” to me, so I asked him to send me the prospectus. Here is what I found:
The investment is a 6-month note that pays 10.15% (annualized). But, if over that six months Exxon stock (the reference security used in this case) trades below 85% of its initial value, and is below 100% of the initial value at the end of the period, the investor gets the stock value rather than the original investment. (This is called being “knocked in.”) Overall this sounds attractive, but…
Using data back to 1970 (which is all I had handy) on XOM (Exxon), the investor would have been “knocked in” 22% of the time. Thus 78% of the time the investor got (annualized) the 10.15%. The other 22% of the time the investor gets the (annualized) 10.15% plus either the original investment (if the stock is back over the original price), or the value of the stock.
It may seem surprising, but since the upside is capped while the downside is unlimited, the average 6 month return from the strategy is a loss of 0.71% Thus investing in this note underperforms burying the money in the yard (on average). Obviously it has huge negative skewness and excess kurtosis which is fatal in combination. Here is the frequency distribution:
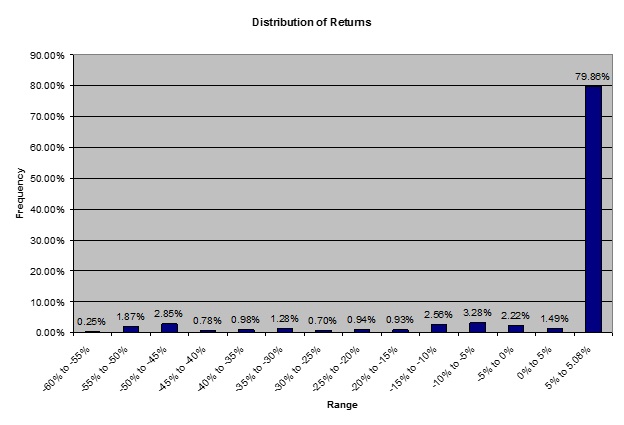
Clearly these are a poor investment. It is equivalent to buying fixed income while selling naked puts. If the stock performs as it has for the last 40 years, the compound return from this strategy (annualized) is -1.99%. So why was the advisor so excited about something that on average loses money? Well, most of the time (80%), it did fine so the client is happy, not realizing they have done the equivalent of buying a coastal home with no insurance that gets washed away periodically. The other years it seems great!
More importantly, and all too typically, the advisor got paid a lot to not look at it too closely. The commission on this product is 1.75%. So, since this is a six month deal, if they keep rolling them (which is what this advisor did), the brokers are getting 3.5% every year! Commissions of that magnitude should have been a blindingly obvious sign that this is a poor deal for the investor.
In conclusion, these types of products are complicated, gimmicky, and ubiquitous, but the lesson is old: “There ain’t no such thing as a free lunch.”